
It might be nothing
Situational awareness


Just a quick update with a few screenshots of the S&P 500 futures.
It might be nothing, but my trading model is giving warnings over multiple timeframes.
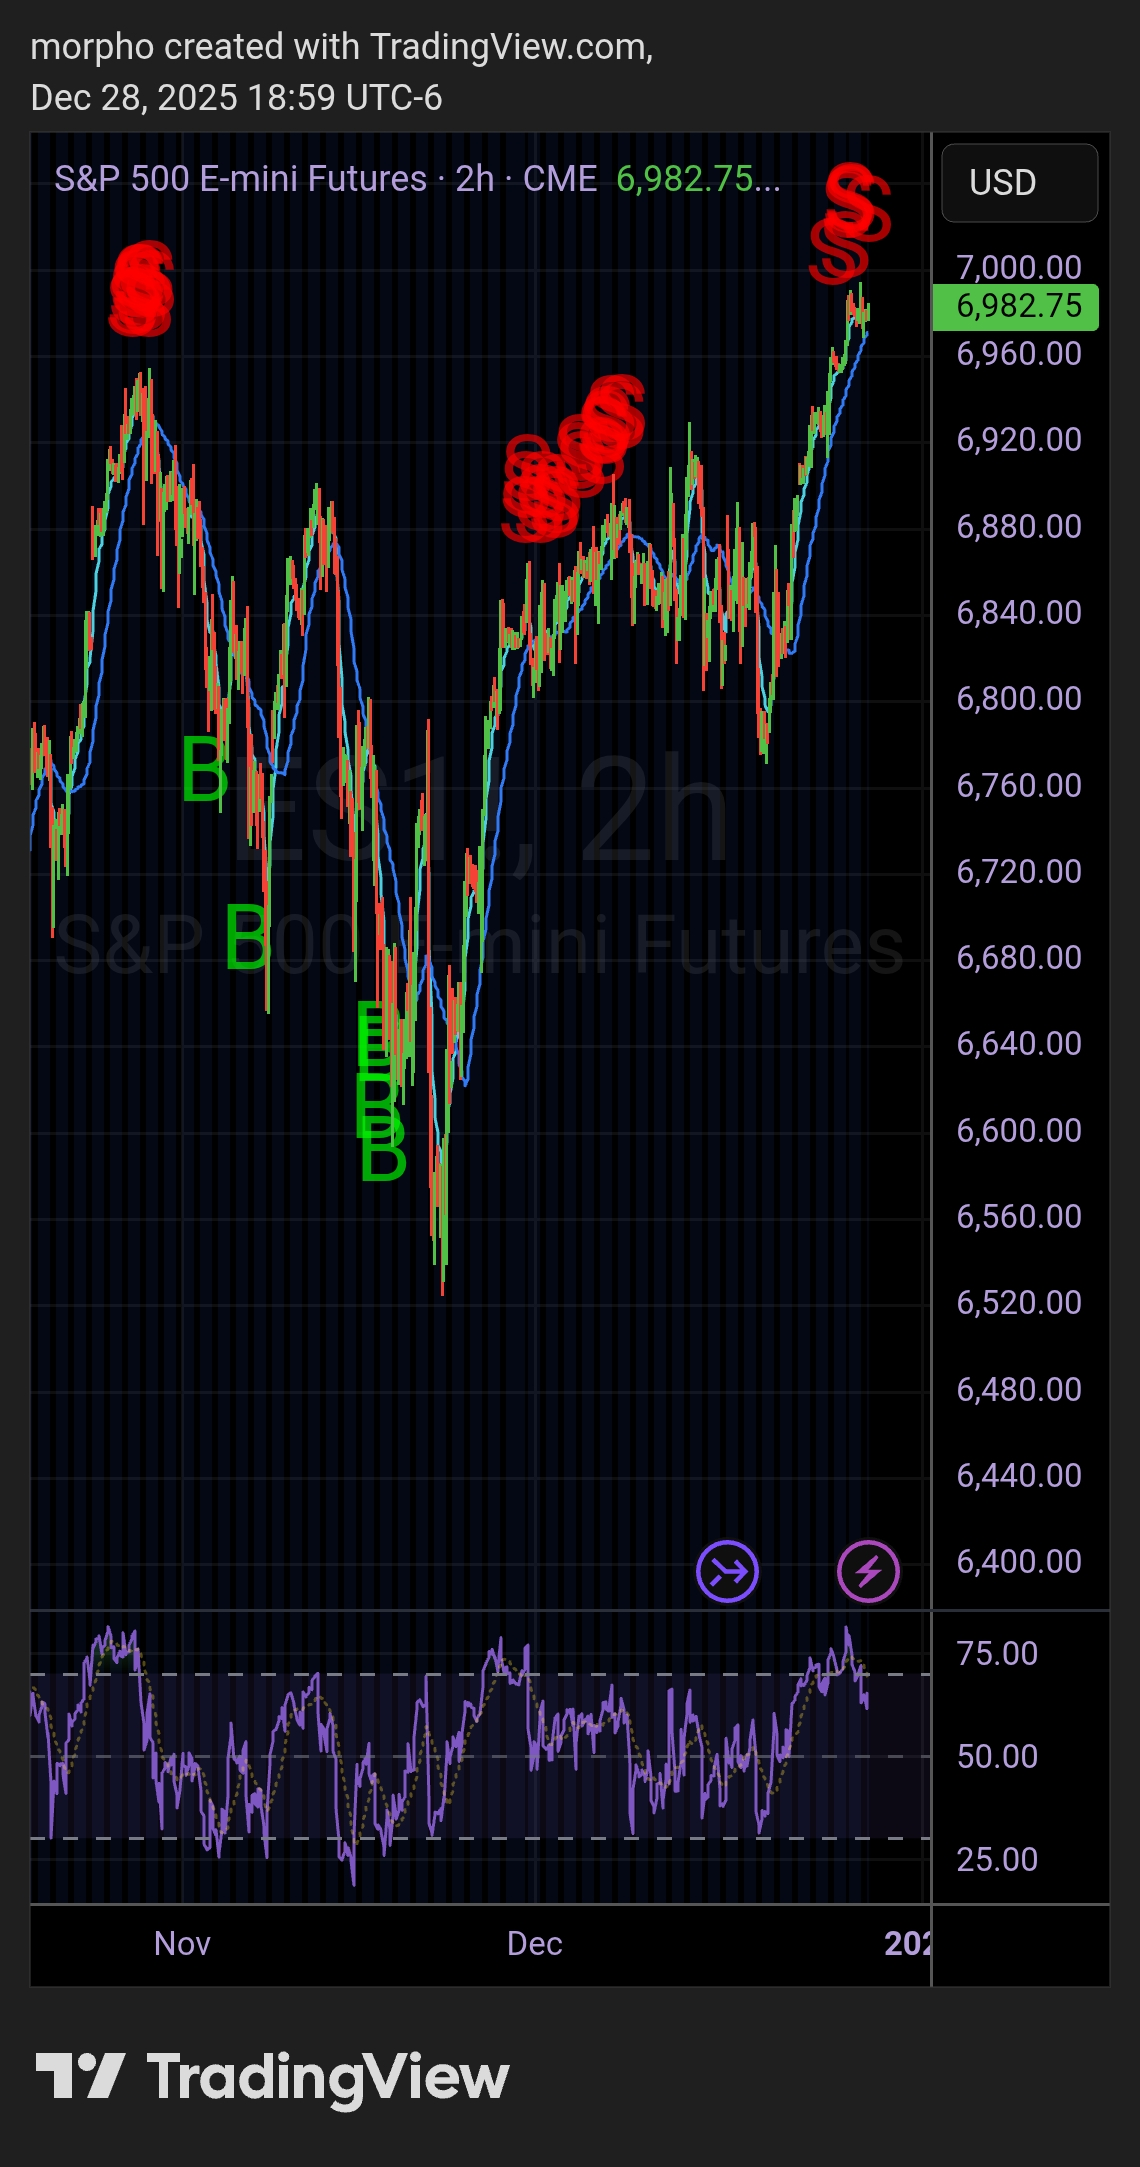
The 2-Hour chart is very short-term and usually for localized fluctuations. However, it can carry more meaning when the signal coincides with the same signal over longer timeframes.
Here are the 2-Day; 3-Day; and 4-Day charts that together show a similar setup to what we saw in the first quarter of 2025 (a-la the decline leading into “Liberation Day”).