

Jolting your JOLTS back to reality
Jolting your JOLTS back to reality
I've already warned you that good interpretation is a scarce commodity!

Note: this post was edited subsequent to its original posting due to erroneous data in one chart.
C:\Users\Administrator\ run C:\Morphology\rant.exe <enter>
Let’s continue our series that pokes holes in prevailing economic recovery optimism and the short-termism based thinking with its associated ‘data grabs’ …
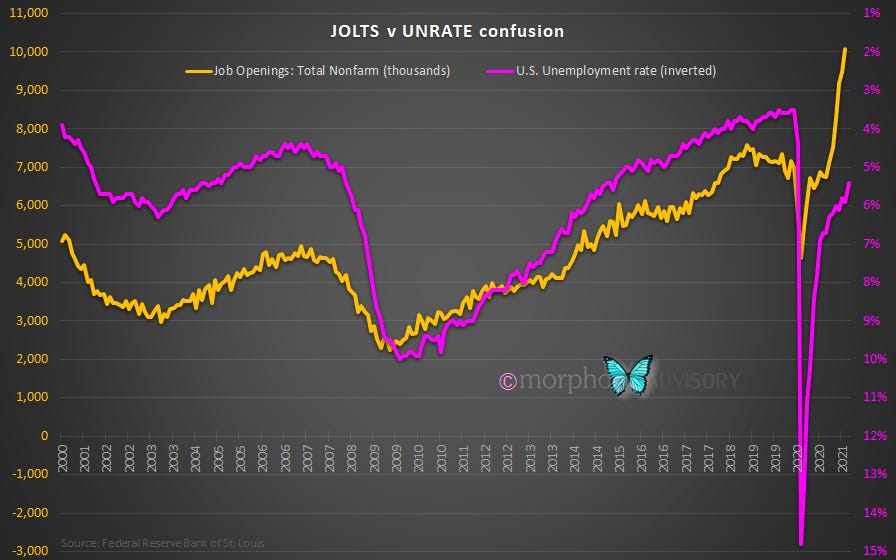
You may have noticed the chart above. Pretty little thing, isn’t it? It shows U.S. JOLTS data (job openings) pushing on to bigger and better things, spewing forth optimism and spreading promise of things to come. It is paired with the U.S. unemployment rate (inverted), which is looking a bit tardy and lacking vitality, like a lecherous elder trying to keep up with the young nubile JOLTS data. This disparity is creating great optimism as job availability is expanding faster than available workers. It must mean growth. It must mean inflation. Nope!
WTF?! I hear you think. How do we explain this one then?
As a thought experiment, let me take you to a parallel universe (sometimes referred to as Japan).
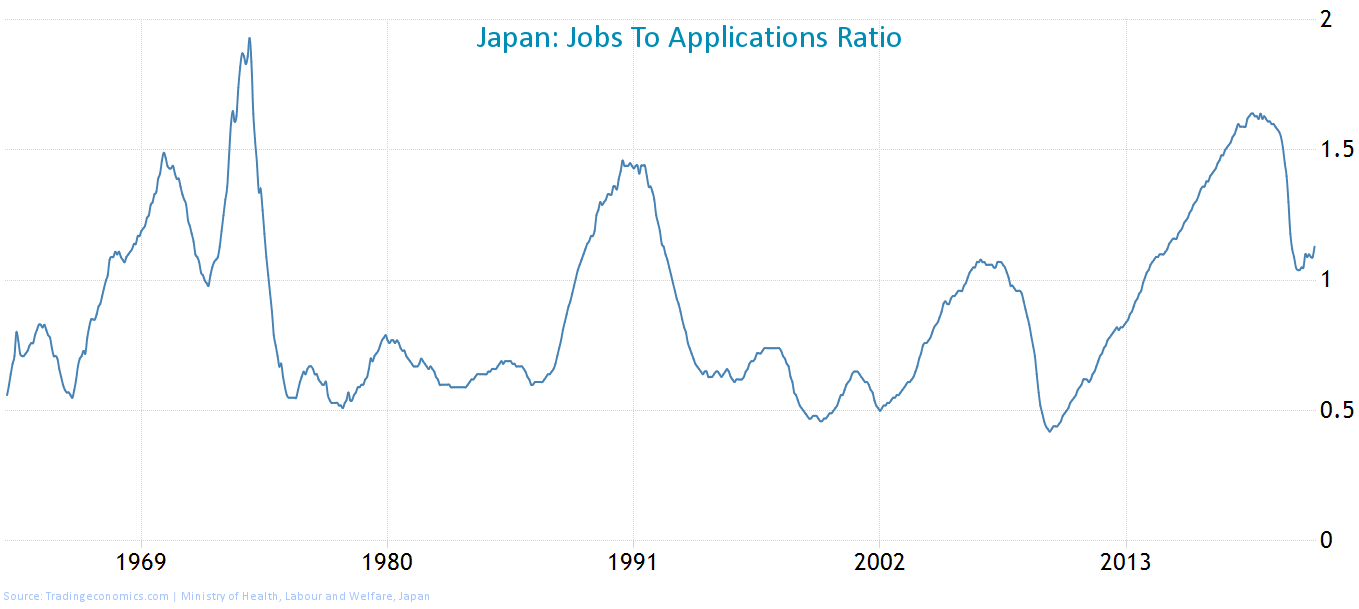
Japan has been in a situation of having more jobs than available applicants for a decade now. You would imagine that their economy is tickety-boo then, wouldn’t you?
Certainly, their unemployment rate is looking low, and we all know what a key metric that is in the models of the grand-high Pooh-Bahs that run our economic shit show.

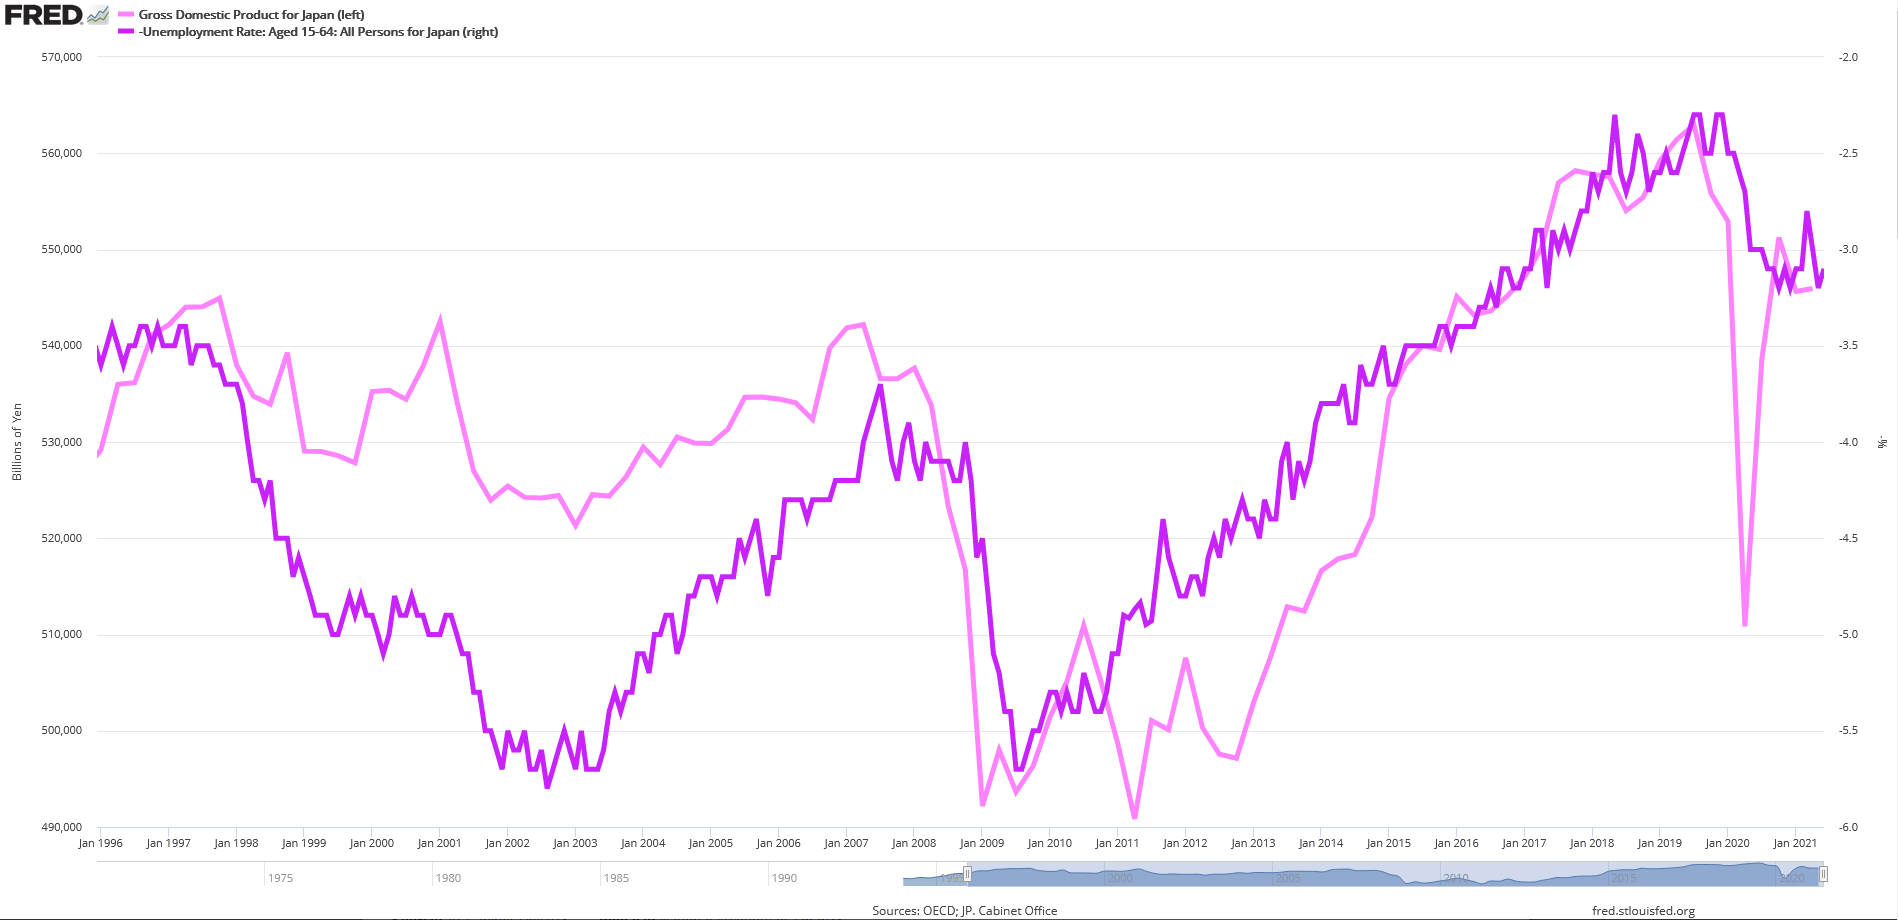
The unemployment rate even seems to correlate with economic growth, so why wouldn’t they, why shouldn’t they, consider it a key metric? Adopted all over by economic think-tanks; coddled and modeled by world central banks; but no - not for me - not a fan I am; I outright reject your UNRATE spam in a can.
Well, the reason being is that, despite it being such a useful metric for a very long time, its time is now over - for the foreseeable future. Oh, I’m sorry. I’m sure it will return again at some point in the future. I apologize if I startled you. Please take as long as you need to recover from my showmanship. It really was careless of me to shock you like that. Cheap trick on my part.
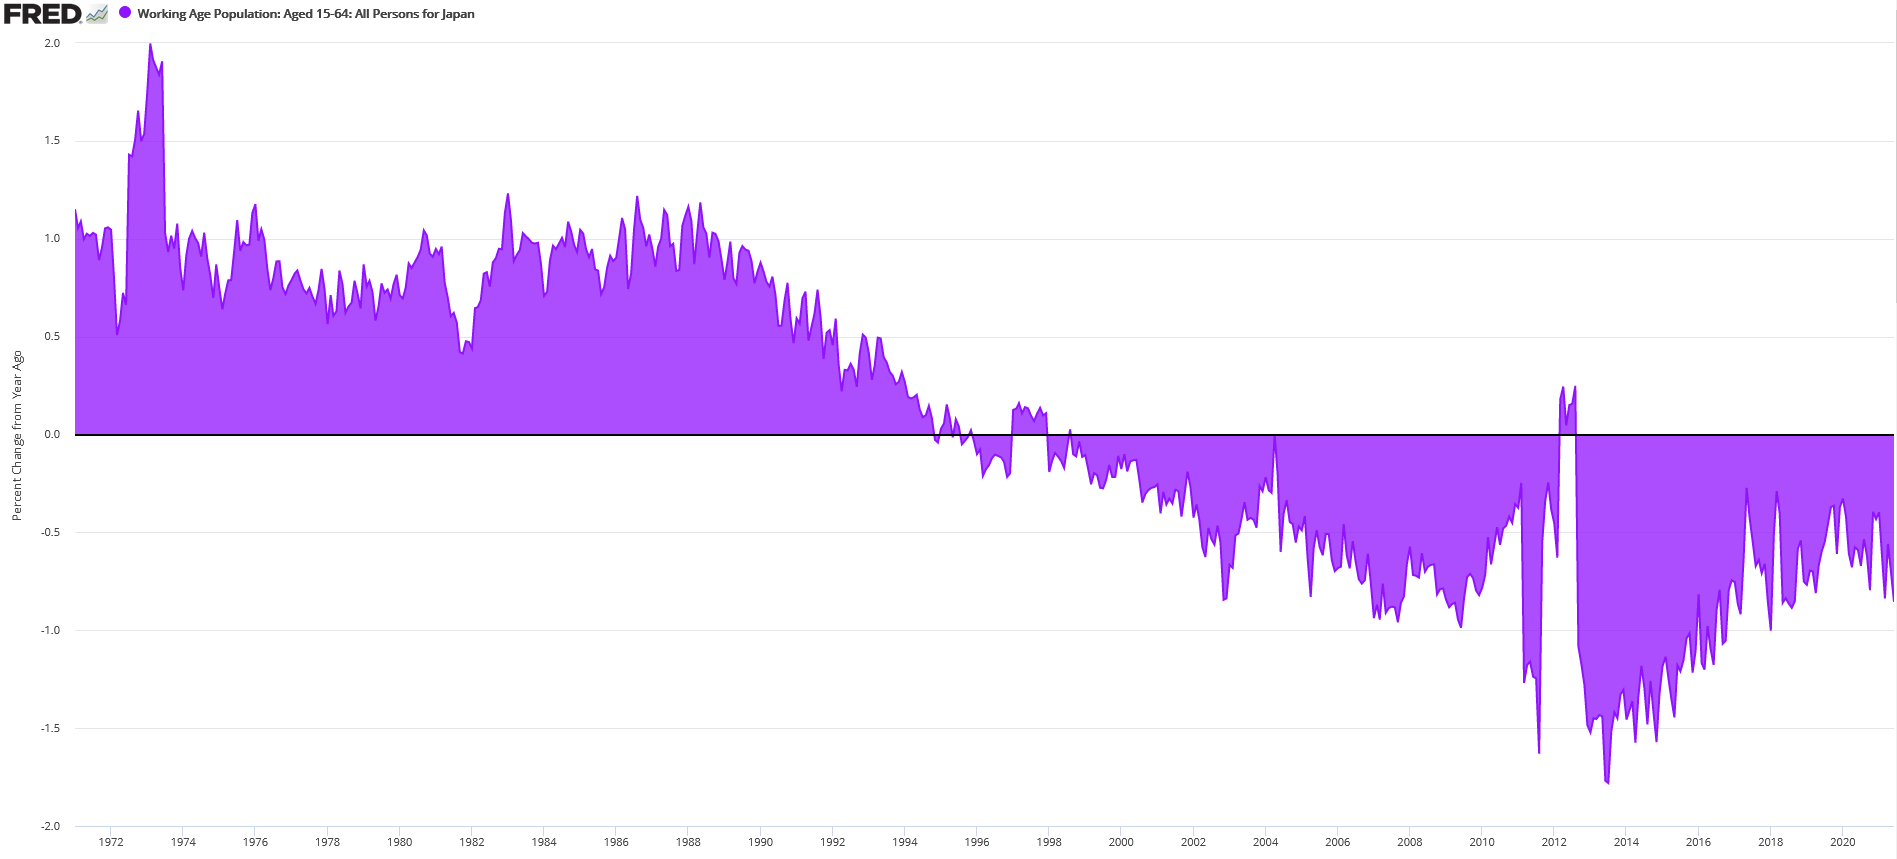
Let me explain. What happened in Japan was that people started getting old. It sort of crept up on them. As the people got old they retired (from work, I mean - I’m not saying they carked it … yet). This has meant that the number of people working started falling, which has been the case for the last 25 years. So, you see, the strong unemployment data at a headline level is actually more of a weak denominator (i.e. shrinking population). As we are all well aware, when you get old you don’t count. This is especially the case for being part of the the working age population.
Here’s another picture showing the same data, just in case some of you prefer to think in line charts (or perhaps you find that year-over-year stuff a touch too abstract - you know, carrying more than a whiff of analytical zealotry).
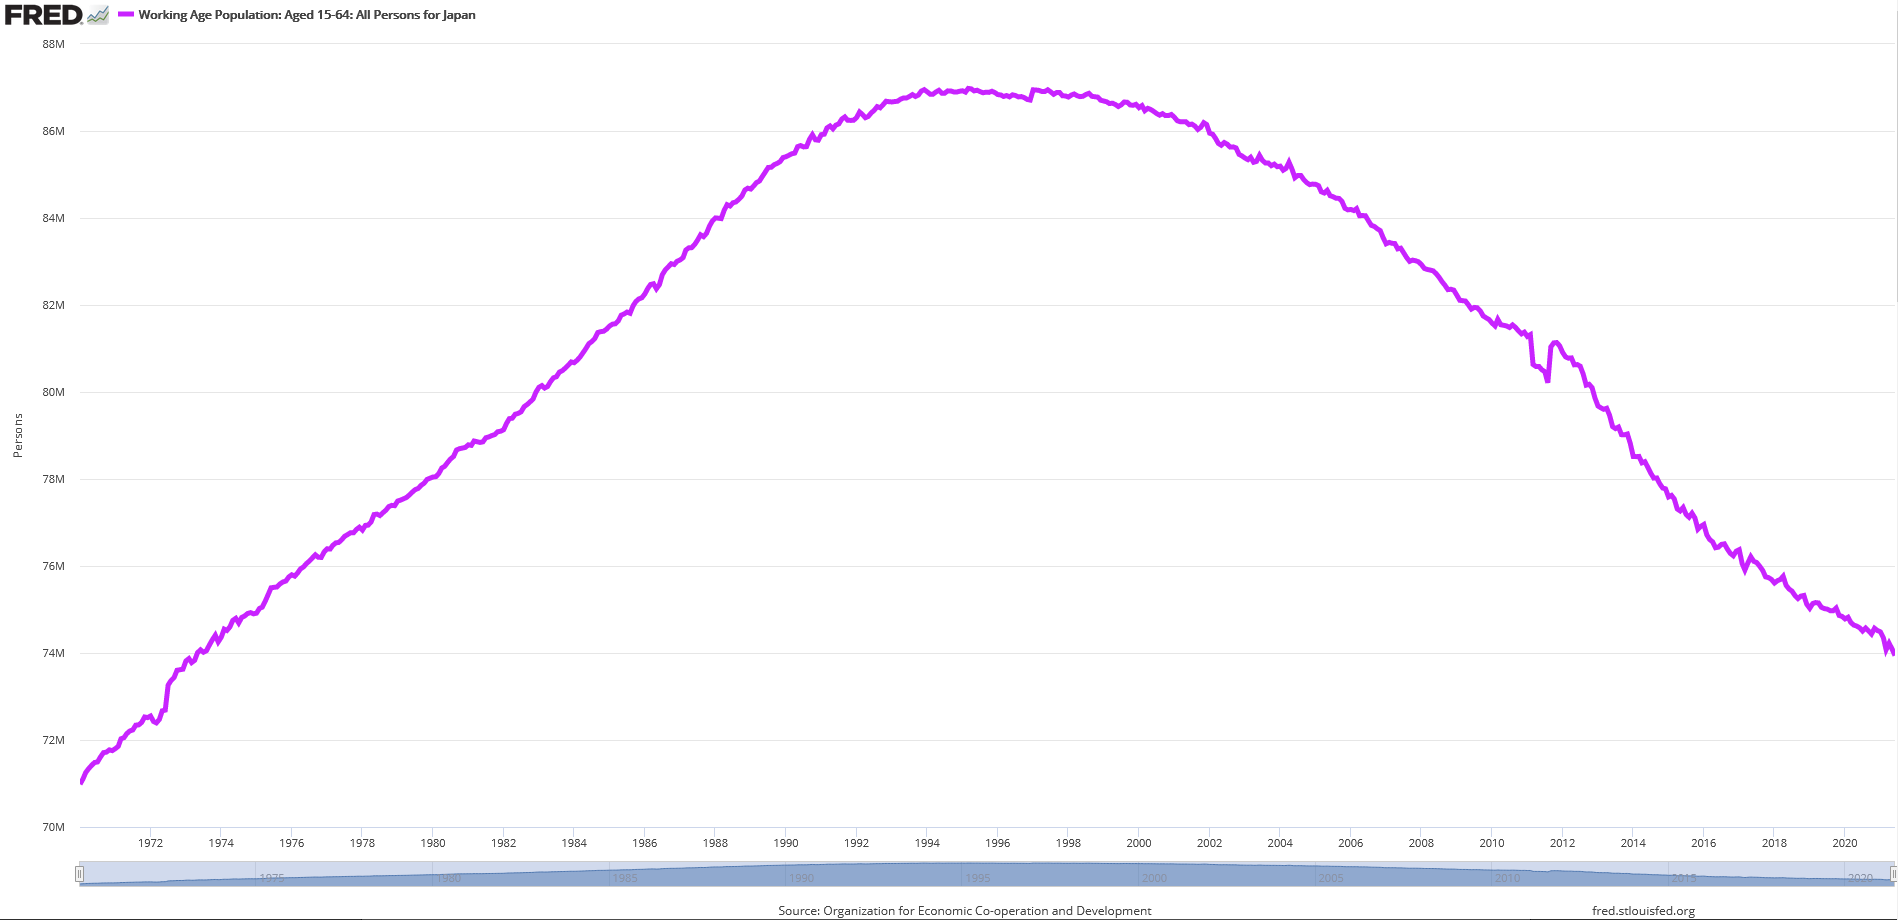
The upshot is, less people available to fill available jobs. OK OK, I hear you. You’re wanting to know the implications for economic growth and inflation?
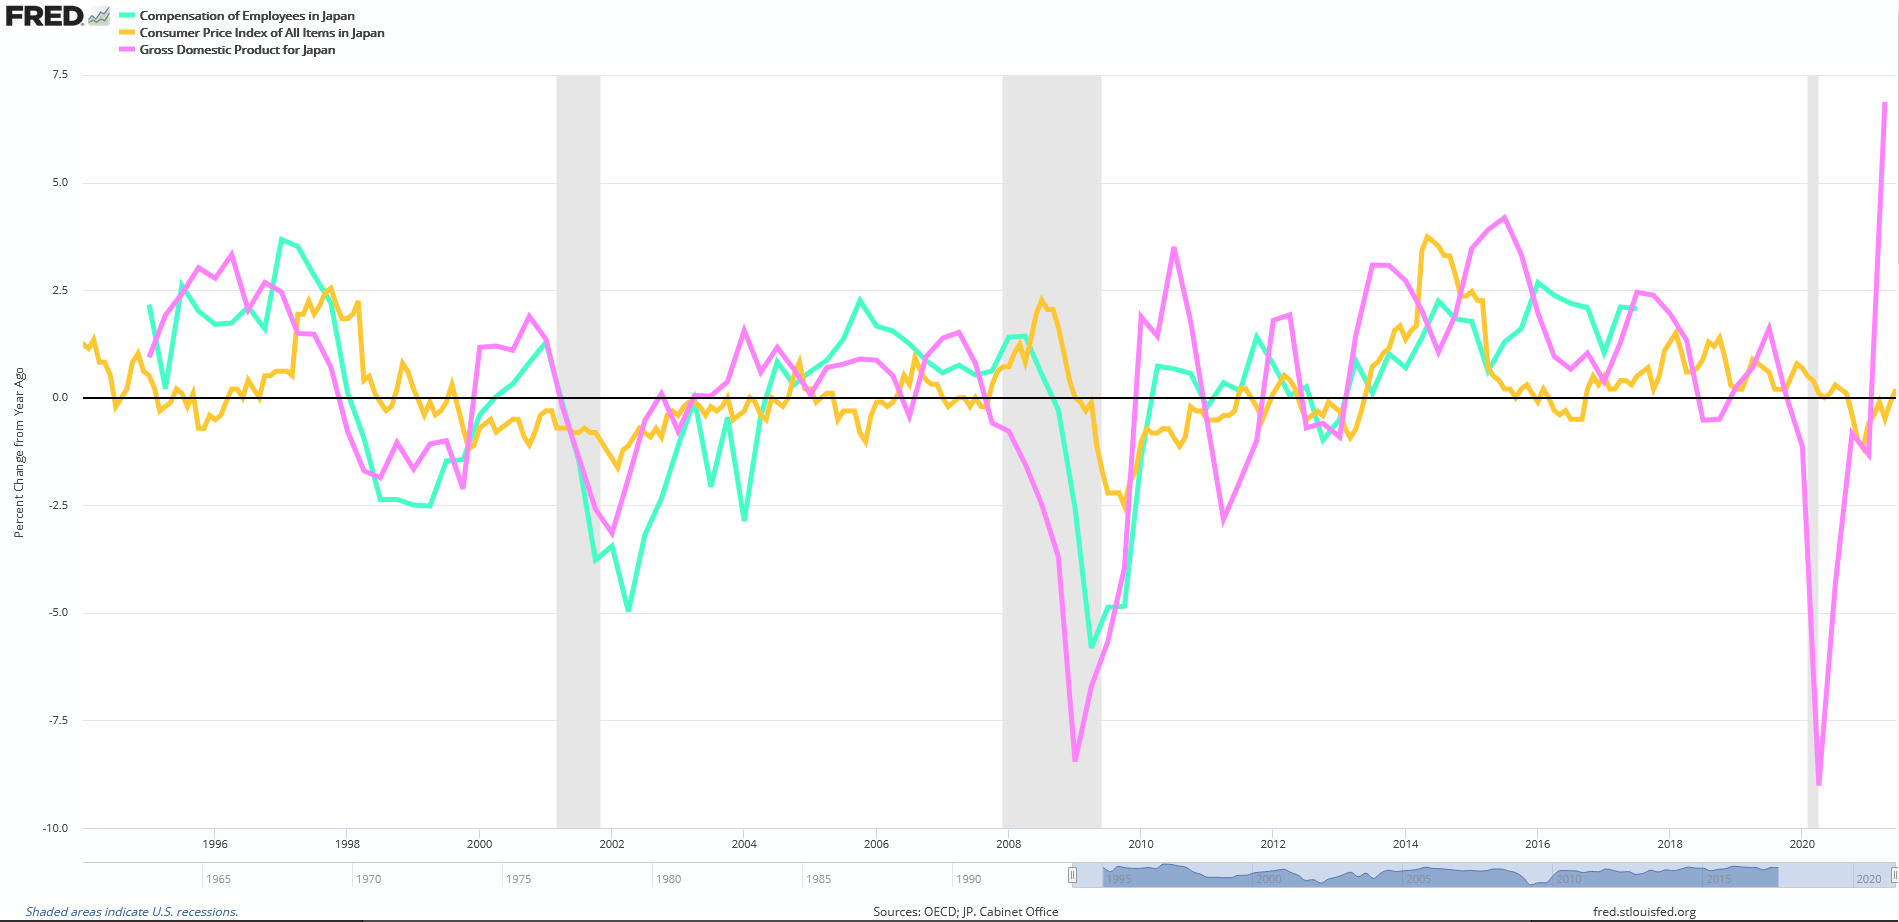
The eagle-eyed among you will have noticed in a chart above that Japan’s GDP hasn’t done much for the last 25 years. It’s essentially gone sideways to the tune of ¥540,000 billion (more or less). Hold on to your hats, we’re going year-over-year again …
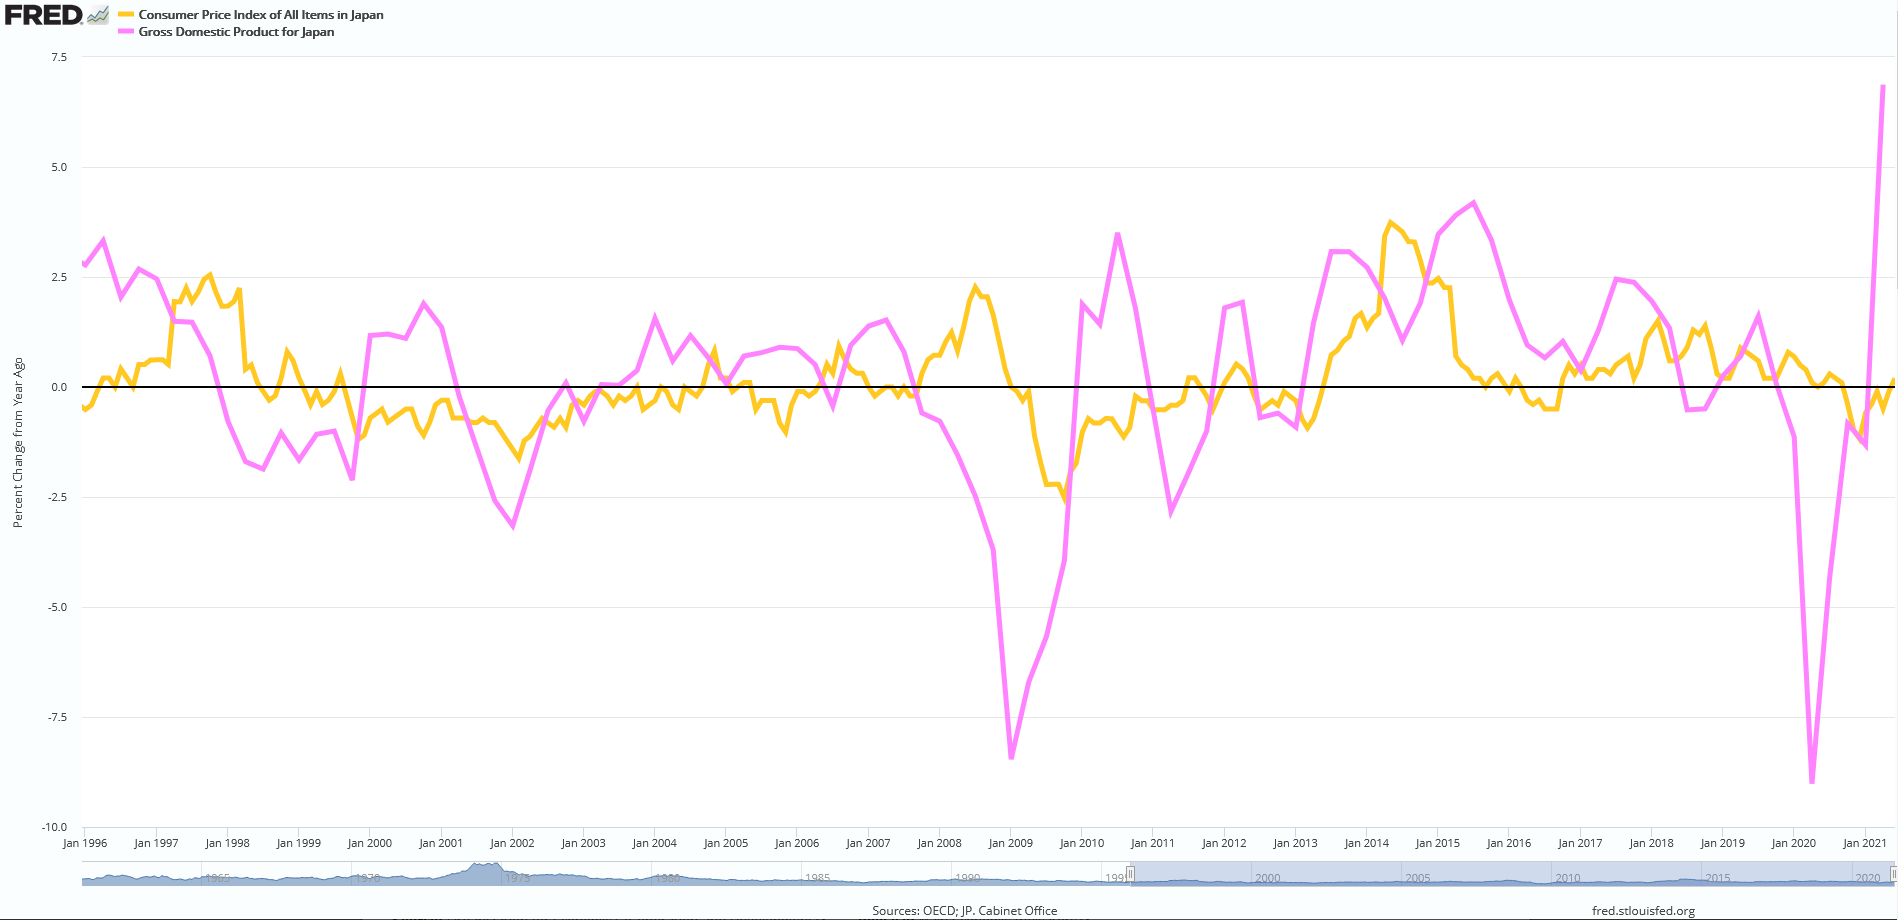
The growth rate of both Japan’s GDP and their CPI has been flat for 25 years.
You’re questioning why job openings being greater than job applicants doesn’t feed into the inflation numbers, particularly wage inflation? I agree. That’s a very curious thing.
Here’s what happened.
Japan was leading the world. Its companies and banks were the largest around. However, at the height of their power, they had taken on significant debt to fuel their continued growth. As their working age population began shrinking, company revenues fell (the working age population are the people who produce, earn & spend). Companies had to cut costs just to survive. Their revenues were increasingly spent on debt-servicing. They became zombie companies.
While companies often spout pat phrases like “our people are our greatest asset”, they are also a company’s greatest expense (i.e. the first thing a company will dump in tough economic conditions). In a stagnant economy like Japan’s, companies might complain that they can’t find skilled workers and talk about a labor shortfall, but they also aren’t prepared to pay up for that labor - because the business can’t afford it.
In the intervening years of Japan’s economic malaise, the Japanese Government has taken on significant amounts of debt to compensate for their weak economy (i.e. low consumer demand and failing corporate profitability), to try and keep the economic machinery running. This is pure desperation and a typical bureaucratic response that refuses to acknowledge failure and take appropriate corrective action (i.e. let those who mismanaged their affairs fail). Instead, the Government of Japan doubled-down on the problem. As with all debt, this is merely stealing from tomorrow’s cash flow (and future generations) to make today better. Debt should only be used to finance something that will generate income to pay for itself plus a profit margin above that. Very rarely will debt work in bridging a temporary (but well defined time period) income gap. All other debt is speculative by nature1.
I’m going to count to three and on the count of 3, you will be wide awake, having returned from our parallel universe trip. 1… 2… 3.
Can you see where we’re going with this?
Guess who’s working age population growth rate has turned negative in recent years? OMG! You guys are on to it. That’s right, the U.S.A. The Japanese example is useful to understand as it foreshadows the demographic changes at work across most Western developed economies including Europe, the U.S., the U.K., Australia etc.
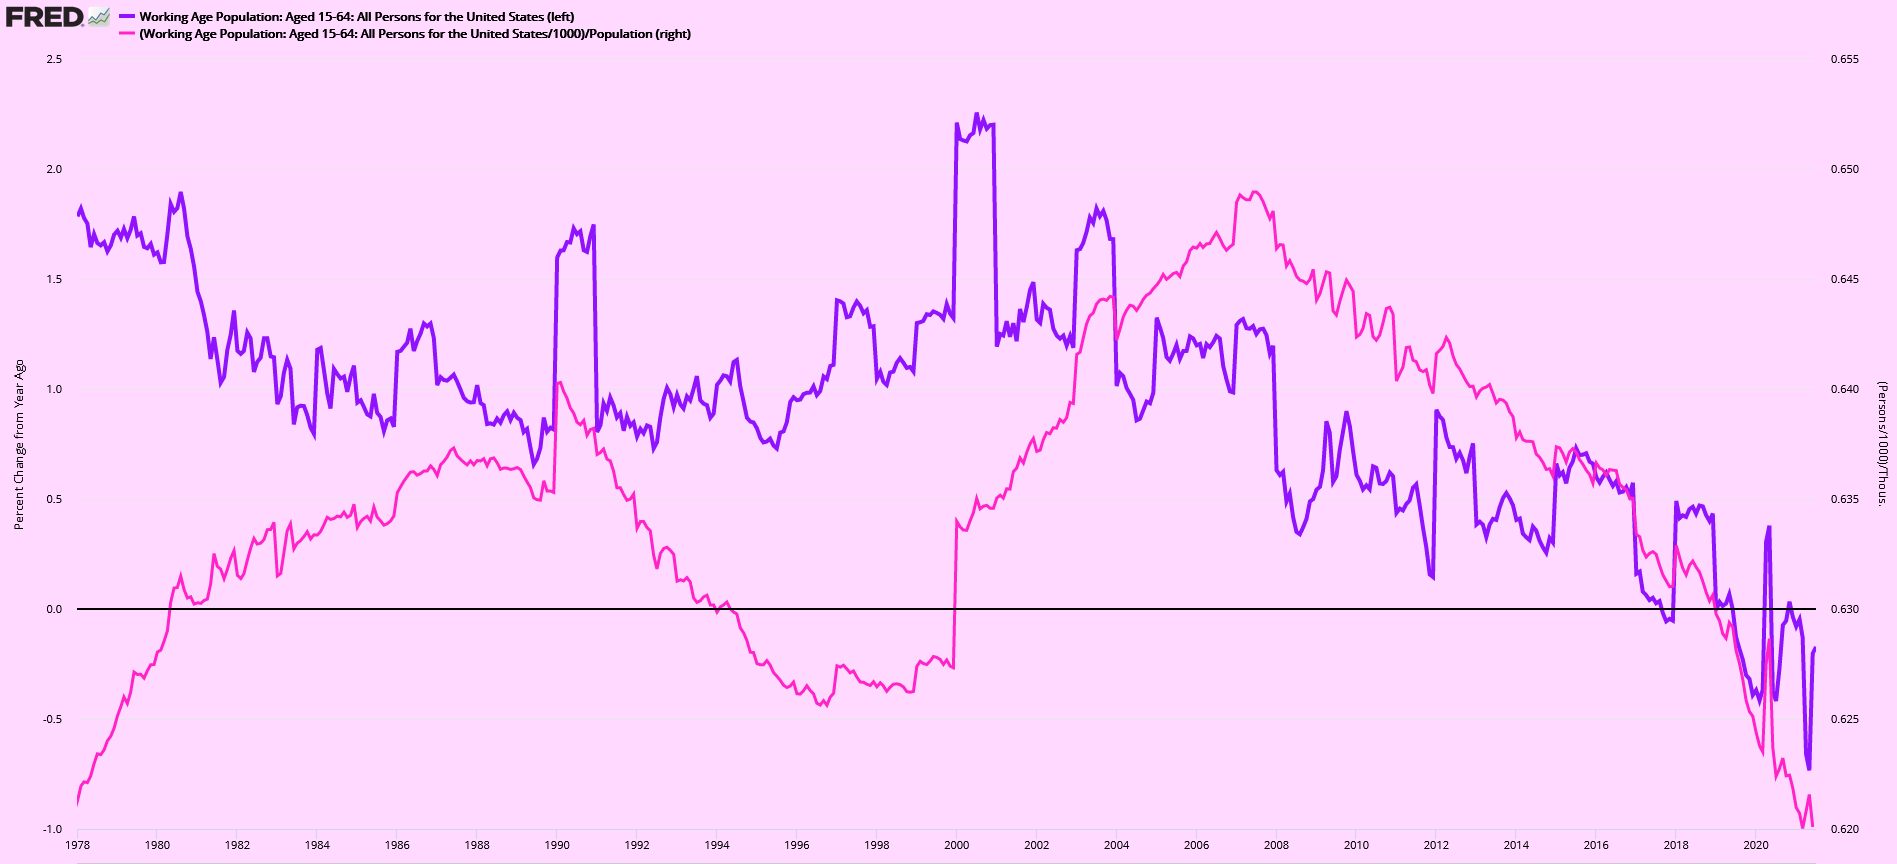
And because you want evidence that it is not just a one-off data blip. Here’s the outlook for the U.S. over the next decade.

That’s right, a touch on the negative side.
Therefore, I surmise, that the strong U.S. JOLTS data that is currently at odds with the unemployment rate (but in an encouraging and coquettish manner) is, in fact, a case of a shrinking denominator and not to be misinterpreted as a strong economy imbued with powerful inflationary gong-fu.
The strong JOLTS data tells me that Boomers are taking the COVID situation as their signal to finally step away from the workforce.
The U.S. Federal Reserve are missing this point. They are looking at the headline labor market data as their key indicator to begin reducing their “emergency” liquidity actions that has driven equity markets blindly higher (i.e. the Fed are going to taper their bond purchasing [QE]). It is quite possible that in so doing, the Fed will trigger a market event at the same time that their economy enters long-term stagnation. Of course, the Fed is entirely blind to this because you don’t hire thinkers to these institutions, you employ people who talk the party line and don’t rock the boat - people who look good on paper.
The U.S. economy will struggle to grow over the next decade and the U.S. Government will continue doing what it has been doing for the last decade - i.e. taking on debt to more than compensate for falling private debt in an attempt to make their economy look healthy. While the U.S. scenario is not likely to be as long or as deep as that of Japan, the U.S. is doing everything wrong, i.e. they’re doing just what Japan did.
C:\Users\Administrator\ run C:\Morphology\rant.exe <break>
C:\>
This has interesting longer-term implications for global residential property markets amongst aging populations. What has been very profitable for a long time on the way up due to demographic tailwinds may not be so attractive for a number of decades to come. It is this factor that might just prolong the weakness of Western developed economies, because property ownership has been the backbone of consumer demand, i.e. buy a house and then fill it full of shit. Certainly, the Japanese experience shows that property is not a means of making capital gains. Their property values are currently 35% below their all time high from 30 years ago, having fallen as much as 47%.