

Labor shortage means a weak economy
Labor shortage means a weak economy
It's the fucking demographics, Dummy!

I know I’ve hit this subject a bit lately, but it’s REALLY important right now. Usually it isn’t so critical because demographics are slow moving, but a tipping point is at hand. You know what a tipping point is. It’s when nothing happens slowly until something happens all at once. Hmmm, that sounds a lot like risk.
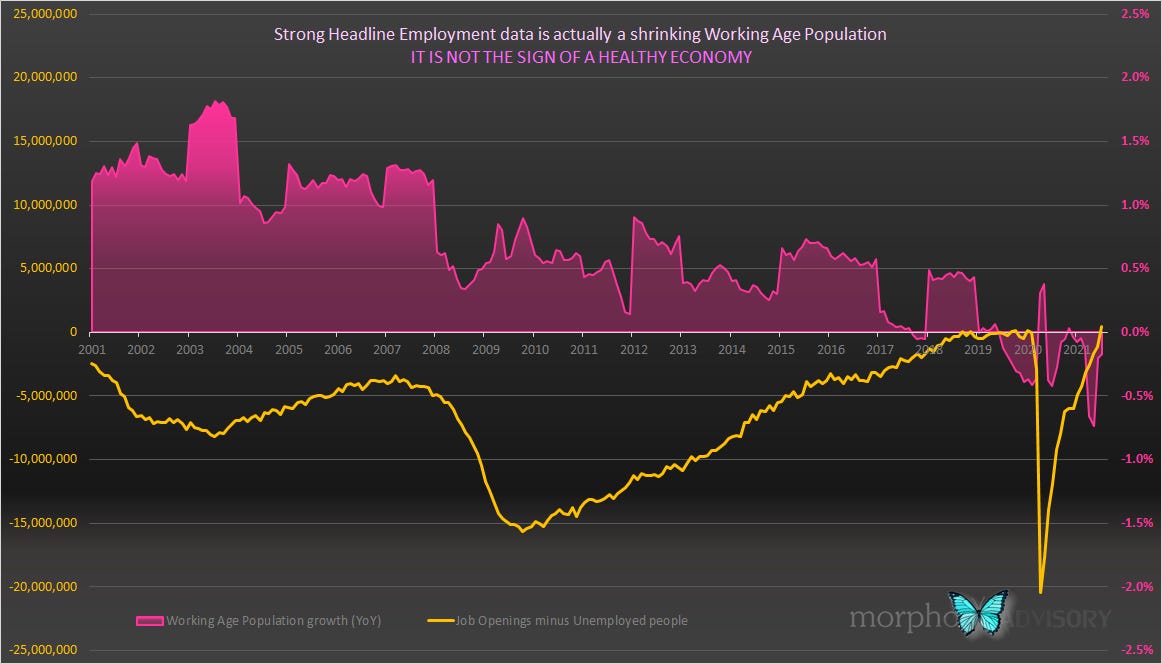
I said in my last article that the current strong headline employment data is misleading because it’s being caused by a major demographic shift. There are more jobs available than unemployed people at present - as the above chart shows, but as I said in that earlier article, it is because the Working Age Population is shrinking (i.e. Boomers leaving the workforce). What the above chart also shows is that when the number of Job Openings exceeds the number of Unemployed people it corresponds with the Working Age Population growth rate being negative. The Working Age Population growth rate hasn’t been negative since WWII.
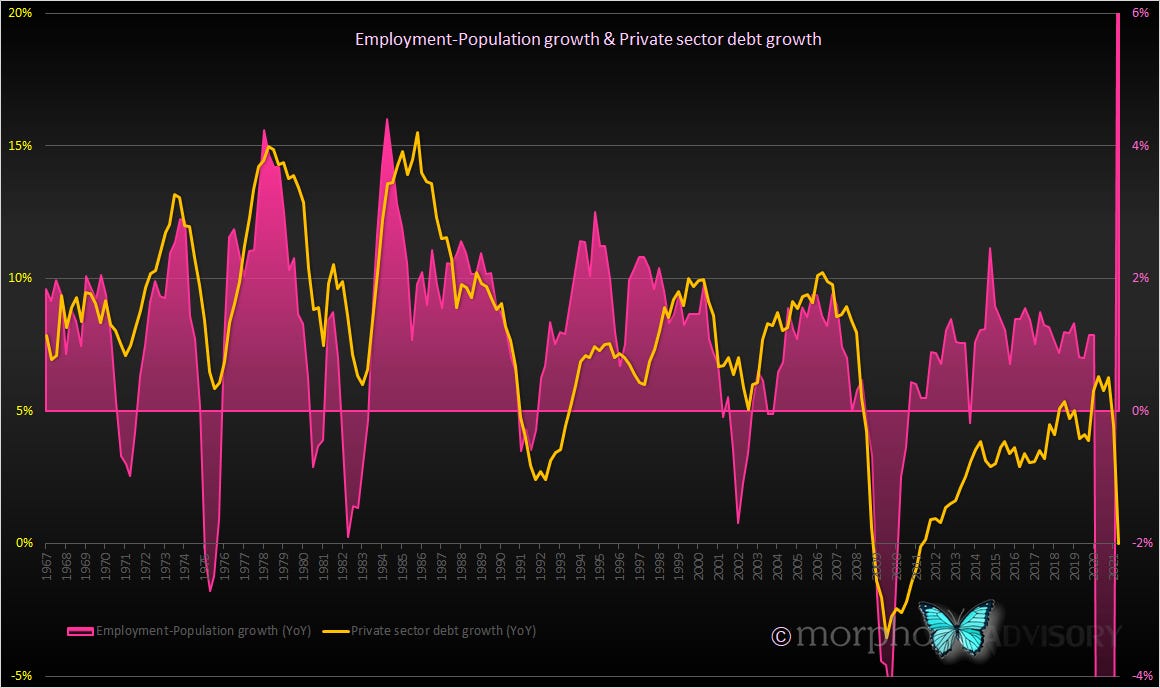
In the last article I brought up the fact that there is a relationship of approximately 1% in Working Age Population growth equating to 5% of GDP growth. It is unsurprising that this is primarily due to leverage (i.e. debt). That same ratio is the standard bank lending ratio on residential property (i.e. they’ll generally lend up to approximately 80% of a property value). As people reach working age, they begin to form new households. The following chart shows the leveraged relationship between the growth in private sector debt and the growth of the Employment-Population ratio1.
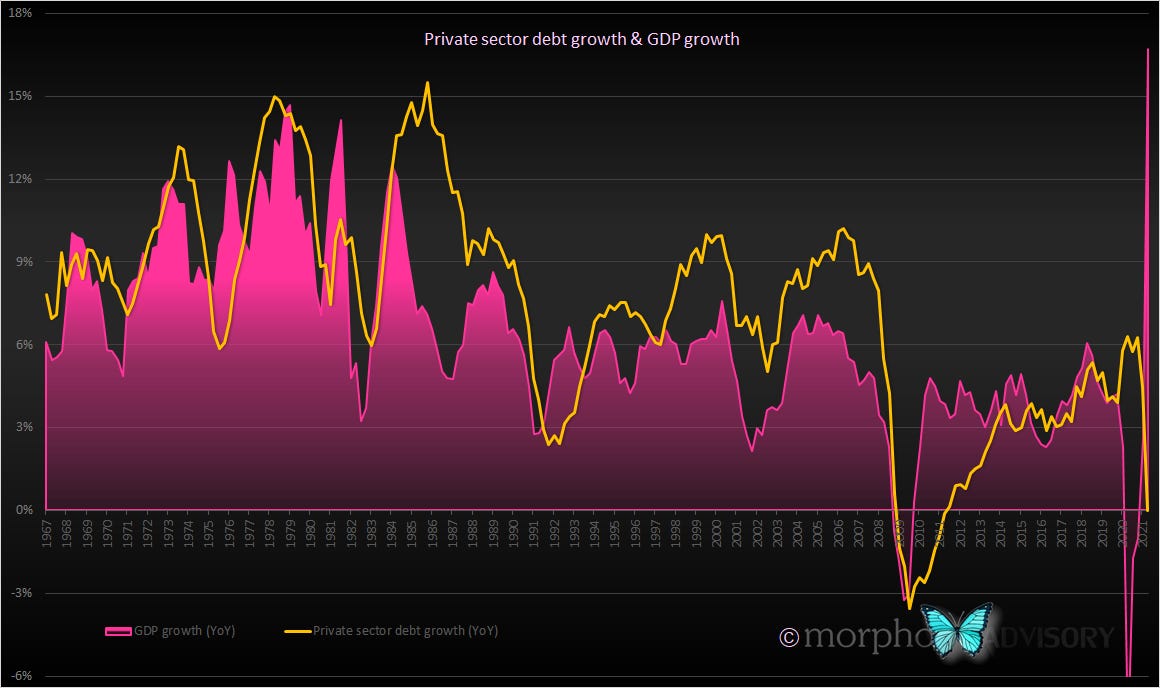
The relationship between private sector debt growth and GDP growth is very strong, as the following chart shows.
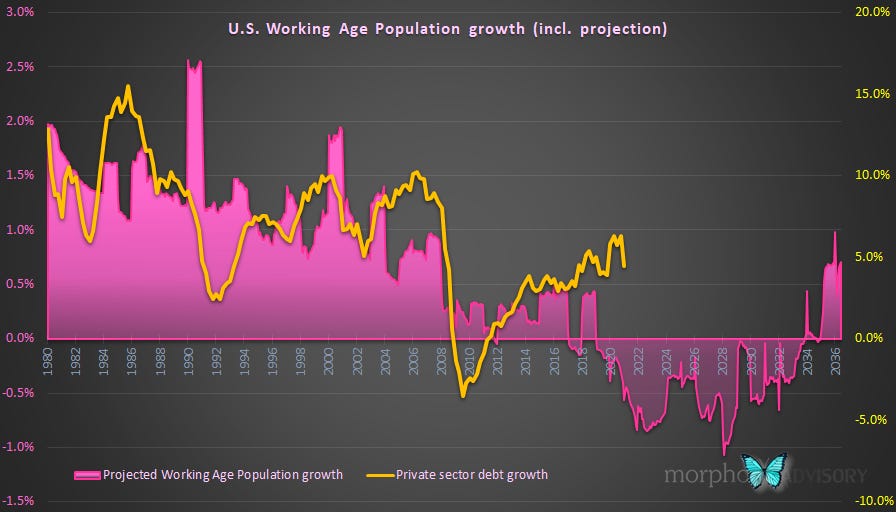
So is the relationship between Working Age Population growth and GDP growth, which I forecast as being negative until the mid-2030’s.
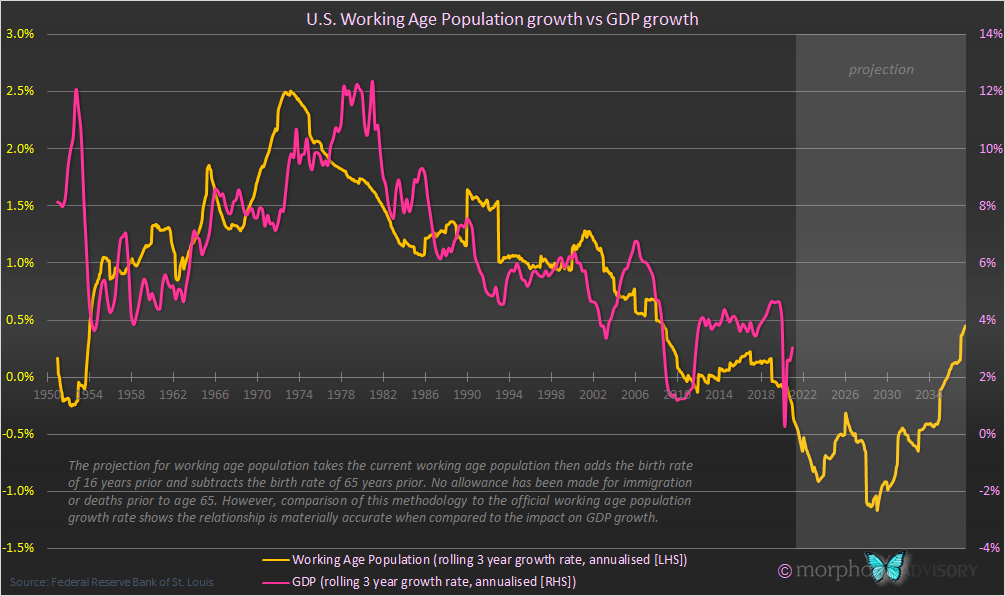
As you would expect, I also think private sector debt growth will turn negative.
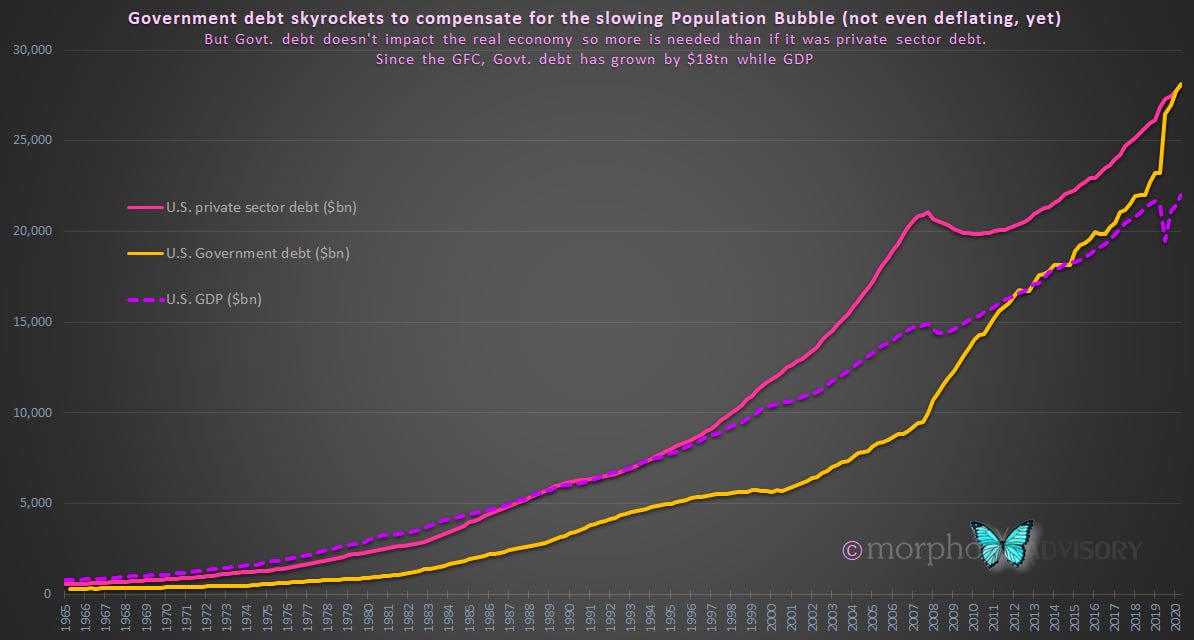
This all suggests strong headwinds for economic growth in the U.S. over the coming decade. But you know that the Government will try to borrow their way out of this hole, just like they’ve been attempting ever since the GFC … because they don’t understand the cause of their problems or how long it’s going to last.
Anyhow, we’ve looked at how GDP growth is primarily driven by Working Age Population growth and their use of debt to build themselves a household etc. Let’s now go back to the top and review.
The gist of what I’m saying is that the strong headline employment data that everyone is celebrating, i.e. more Job Openings than Unemployed people, indicates that people wanting jobs now have a larger slice of the pie than before. For them, this is a good thing. However, before people celebrate too much, they need to know that the size of the pie is shrinking. A 1% percent change in the Unemployment rate is of a lesser value than a 1% change in the Employment-Population ratio.

Additionally, there is a maximum of 5% until 100% employment is achieved (which is highly unlikely even in such extreme times, as proven by Japan over the last 3 decades). However, the U.S. faces approximately 15 years of negative Working Age Population growth at an average circa -0.5% per annum. So, the population aspect is both bigger in terms of marginal impact and bigger in terms of absolute potential change than the unemployment rate.
By all means, go ahead and celebrate the larger slice of the action that positive headline employment data is indicating, just be sure to check whether you ordered the mini or the extra-large pizza before celebrating the size of your slice.

This ratio is impacted by business cycles so it fluctuates with unemployment levels more than the Working Age Population.