

The madness of an inquisitive mind
The madness of an inquisitive mind
or maybe it's just my Gemini-rising?


In my bio I describe myself as per the title of this article. That is because I readily confess to having a mind that just doesn’t stop. It wonders, it ponders, it creates, it interprets, it observes, it analyzes and so on and so on …
Yield Curve
I demonstrated this quality in my last post in which I detailed my thinking before I created a new way to evaluate the U.S. yield curve as well as explaining why I believed it needed to be re-evaluated.

A year or so back I developed another model one curious day. At the time, I was pondering whether I could develop a trading model that would capture market trends, deviations from said trend and possibly signal reversions to trend, if not outright changes in the trend. I threw together a basic construct, played around with elementary coding on Tradingview and then applied some mathematical ideas that I had floating around in my head. The result was a model that I’ve occasionally posted output from on my Twitter account, which you may or may not have seen. The following chart is an example of this model’s output. In it I have applied my new U.S. yield curve methodology (as show above).

As the yield curve is best used for larger timeframe analysis, that is what I’ve used. This chart indicates that the recent steepening of the U.S. yield curve may have already peaked, which is interesting given that I hinted at this possibility in my last article without having looked at it through the viewfinder of this model.
Let’s look at some more examples of what this trading model is seeing at present. Bear in mind that for most charts here the timeframe is longer-term, which favors positioning rather than trading and, as such, this model is not naturally suited to the use of leverage.
Emerging Markets
MSCI Emerging Markets Index

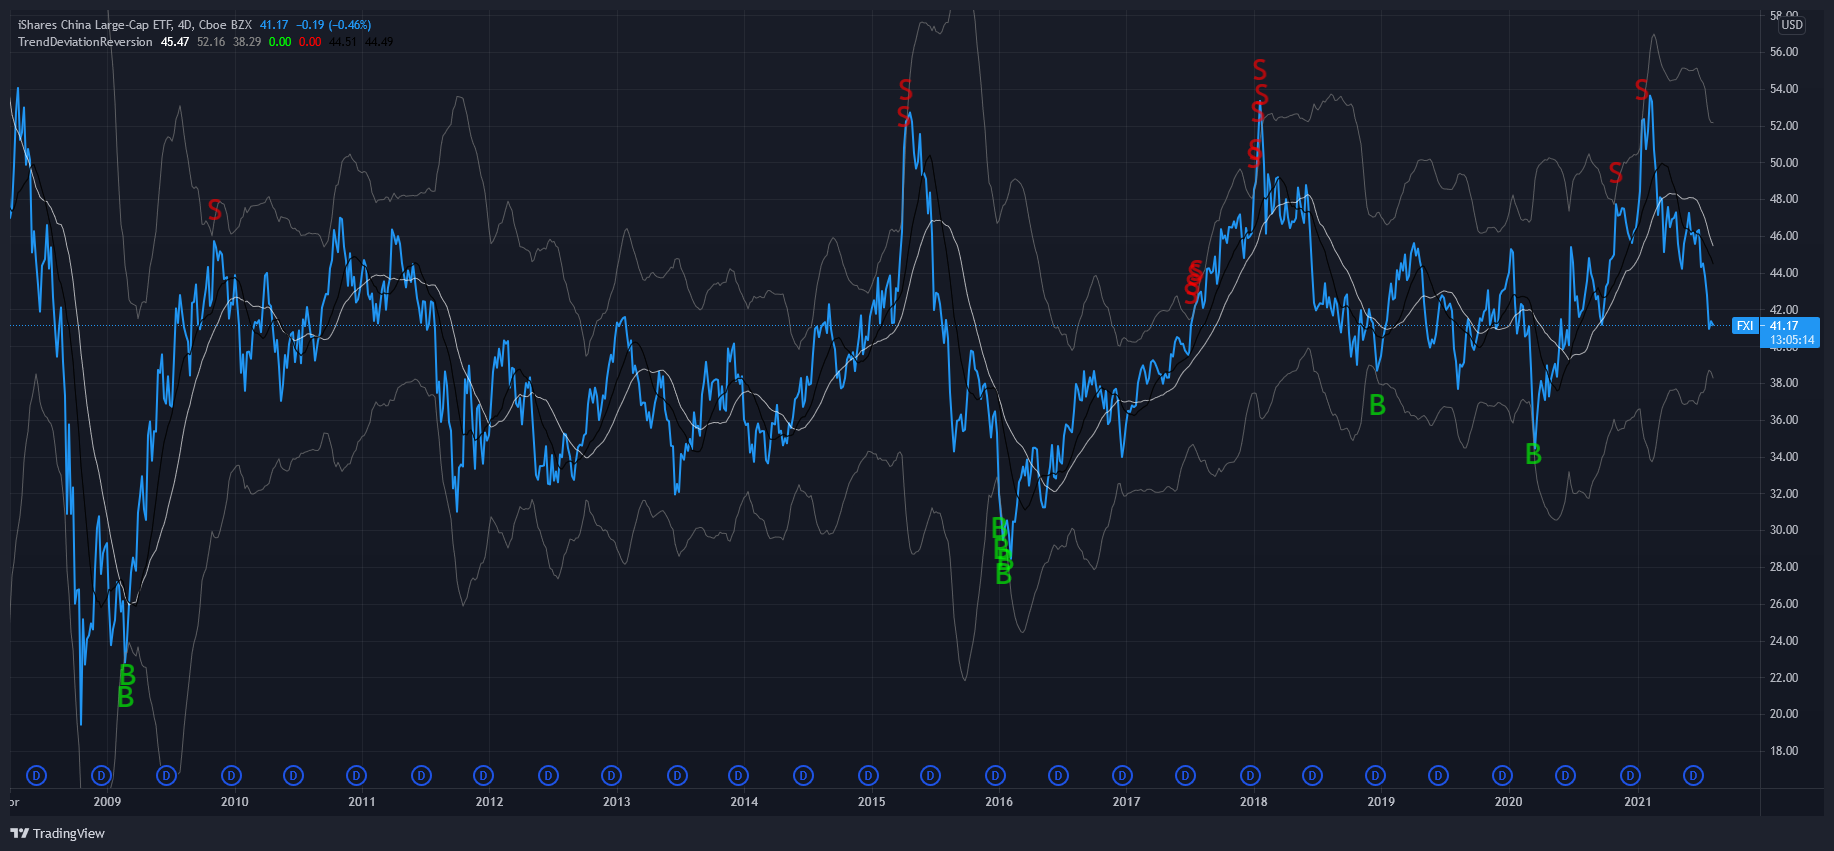
China Large-Cap
Commodities
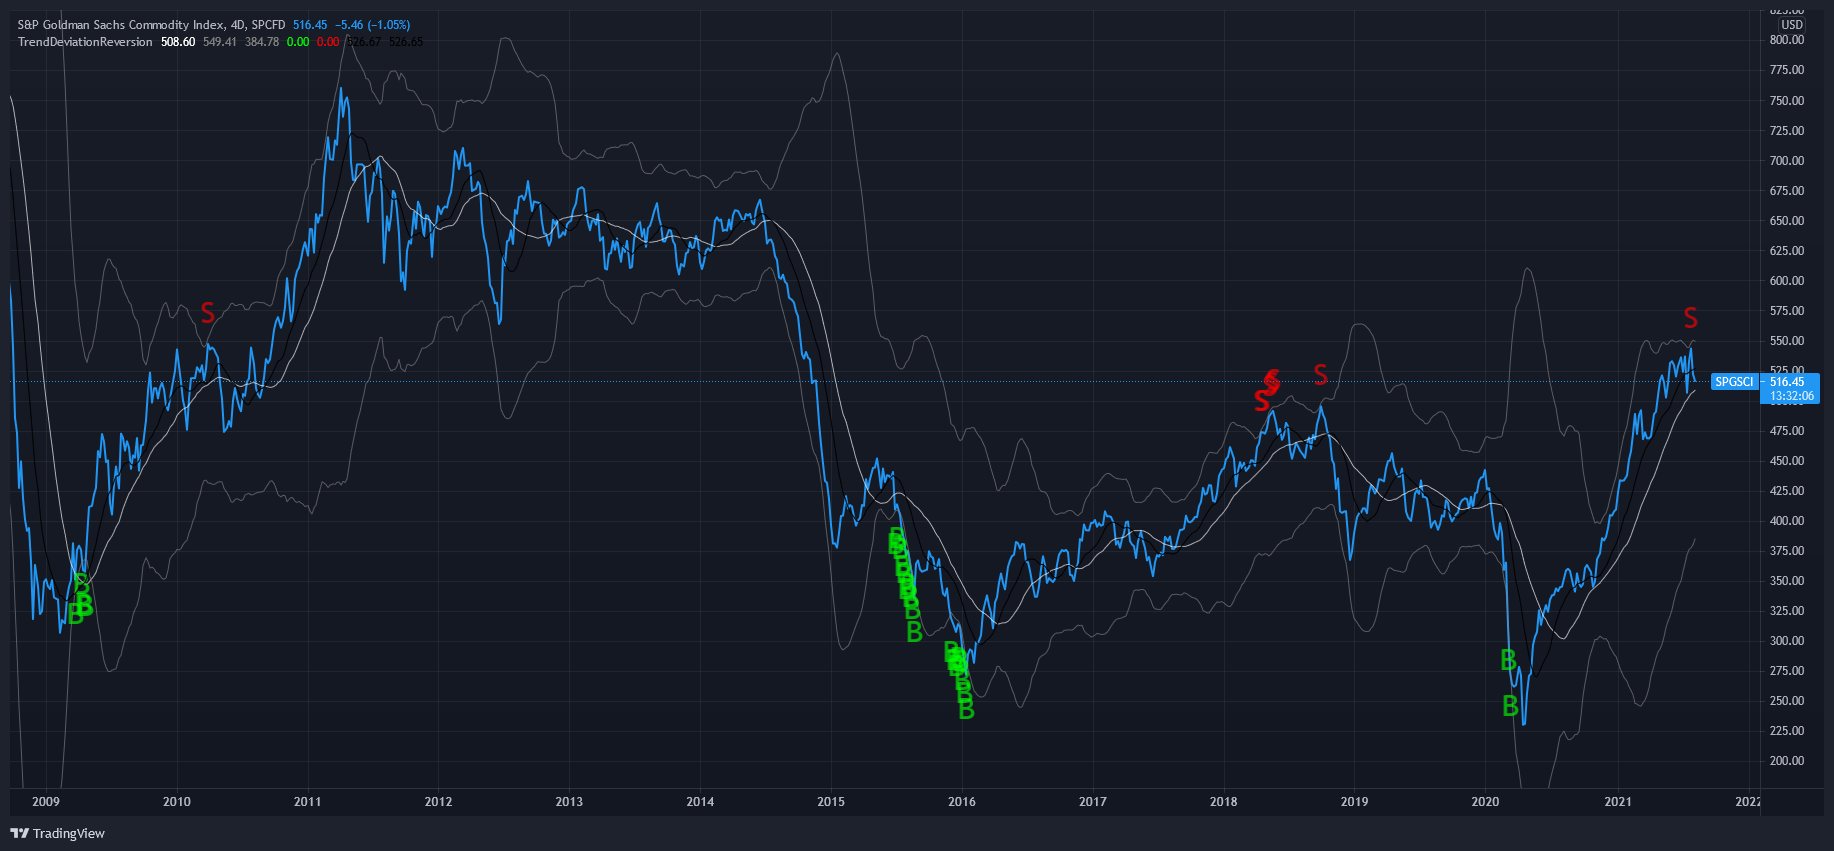
S&P Goldman Sachs Commodity Index
Crude Oil Futures

Currencies
NZD/USD

Large-Cap Equities
MSCI All Country World Index

Fixed Income Credit
High Yield Corporate Bonds

As you can see, the model turned out to be quite versatile. Best of all, I didn’t apply any optimization in the underlying mathematics. Rather, as is my habit, I built a model that I believed should be robust because of its underlying concept and the methodology employed to achieve the desired goal without the need for back-testing or optimization. Only after the model was built did I run market data through it without need for further refinement. My view was, “either the concept will work or it won’t.” However, I did find that certain time-period inputs (as with any charting platform, e.g. hourly, daily, weekly etc.) work more consistently than others.
What you may also observe from the above charts is that the model has been indicating the same thing across many asset classes. Namely, there is greater chance of downside moves over the medium-term than upside - or perhaps a better way to say it is, the model suggests more downside than upside over the medium-term. Certainly other models I’ve posted in previous articles on this site suggest that, but they typically hint at such outcomes from 2022 onwards.
I should note that the signals this model produces can take time to come to fruition. And, if this model has one weakness, it is that it can send false signals during a strong trending market. As such, a degree of familiarity with the model and some interpretation is required, which is why I am selective in terms of when I show signals from this model - like now. We’ve had the strong trend.
Volatility
CBOE Volatility Index (VIX)
I mention above how some time periods produce more consistent results than others. As an example, I’ve found that the 8 Hour chart applied to the VIX has been an excellent indicator of upcoming changes in implied market volatility. If you search my Twitter feed you will see that I have posted this indicator numerous times in advance of changes in S&P 500 Index volatility.

That brings us to the end of this post. I’m just throwing stuff out there … because I’m curious and inquisitive, and I get inspired at times. I’m not suggesting imminent market falls, but rather suggesting we’re at or near turning points that may take time to unfold. Maybe it’s worth taking on some optionality rather than outright longs? Maybe reducing position size? Make your own decisions. Just be aware that much of what is supporting the current market is not economic fundamentals but government intervention that has created ‘noise’, which is confusing people’s interpretation of the economic environment. What the model that I’ve demonstrated here does is it captures market behavior - what is actually happening. It captures the collective unconscious that is supposed to be rational, but in reality is subject to manias and panics more often than people would care to admit.