

The World of Finance is Skewed
The World of Finance is Skewed
Based on askew theories, it ignores reality. This skew will screw you.

I apologize in advance for getting a little derivative in this one, but hopefully I’ll make an important, albeit abstract, concept easy to understand. Please understand that I myself am no mathematician or statistician, I’m more of a tinkerer.
SKEW Index
Let’s start with the SKEW Index. This little piece of academic jiggery-pokery was designed to warn of impending risk in the stock market, specifically the S&P 500 Index. Warnings of potential risk is a good thing. We all want that.
Let’s read the label on the tin from the CBOE white paper:
To get at the core of the skew, the Chicago Board Exchange® (CBOE®) is introducing a new benchmark, the CBOE Skew Index® (SKEW). SKEW is a […] measure of the slope of the implied volatility curve that increases as this curve tends to steepen.
Yada yada yada … it means that if the Index goes up risk is increasing - supposedly. Here’s a more “plain English” version courtesy of Investopedia:
What Is the SKEW Index?
The SKEW index is a measure of potential risk in financial markets. Much like the VIX index, the SKEW Index can be a proxy for investor sentiment and volatility. The Skew Index measures perceived tail-risk in the S&P 500. Tail-risk is a change in the price of the S&P 500 or a stock that would place it on either of the tail ends, or the far edges of the normal distribution curve. These price changes typically have a low probability.
It doesn’t fucking work! Well, it does, but not how it was meant to. That’s the problem with the World of Finance, too much of it is based on academic theory. And academic theory is created by non-practitioners (nerds in classrooms) analyzing data in retrospect - i.e. it’s backward looking. That includes how your retirement portfolio is constructed, as I discussed here.
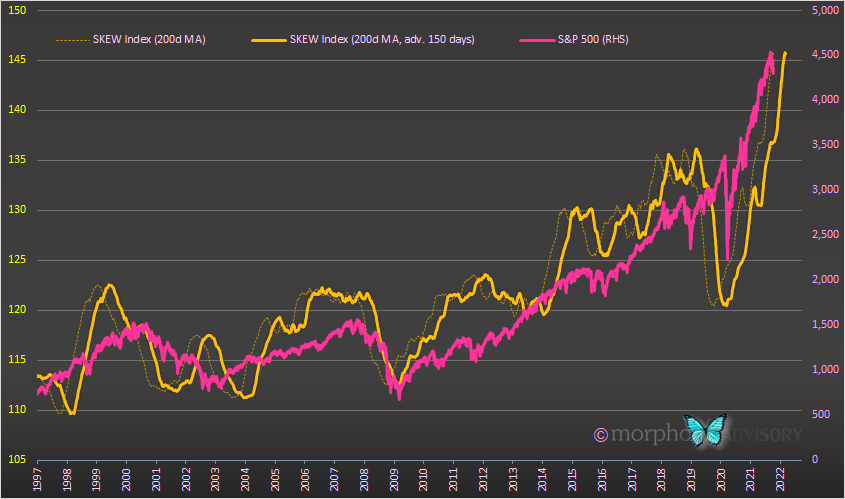
Like I said, the SKEW Index does work, but it does the complete opposite of what it’s meant to. This is another of my unique discoveries (read my older posts for some of the others) that I uncovered a couple of years ago. I found that if you take a longer-term average of the SKEW Index, you could advance it by 6 months or so and it acted as a good broad indicator of market risk. Ironically, the lower the Index the greater the risk! This is the complete opposite of what its design intention states!
Here is a Twitter post of mine from 2 years ago (almost to the day).

I posted it as a comment on one of John Hussman’s Twitter posts. John was kind enough to not only comment, but he also replicated it and optimized the correlation.

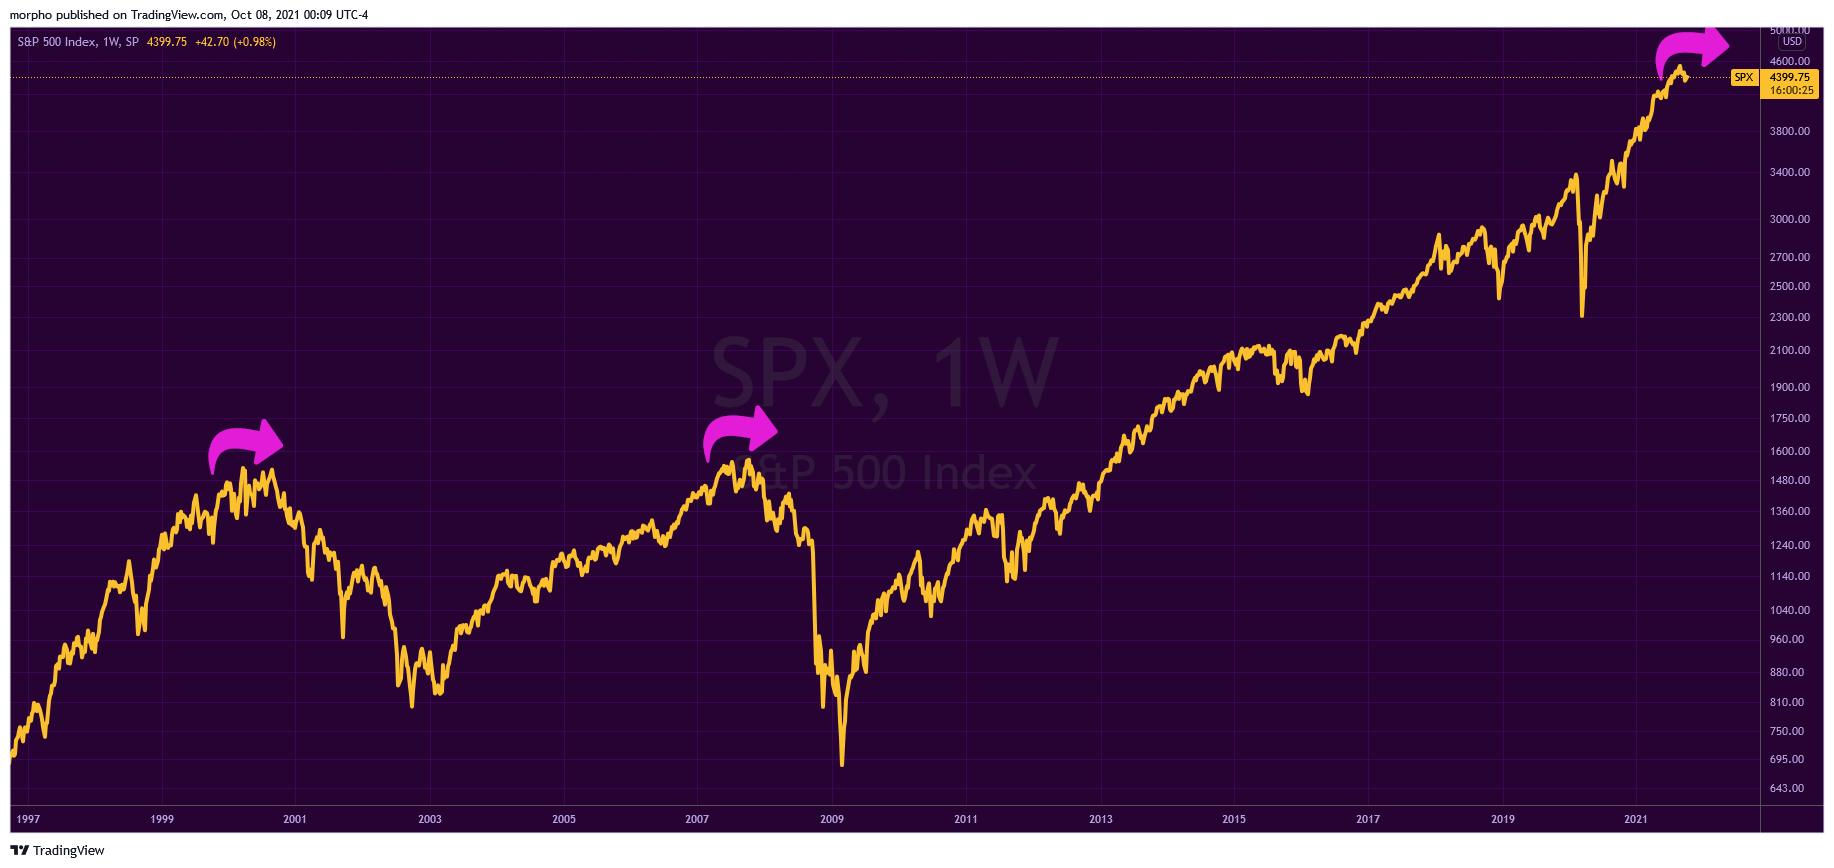
As can be seen in both his version and mine, the SKEW Index was implying that the S&P 500 was going to experience a substantial fall in early 2020. This was after also “predicting” the Dot-Com crash and the GFC.
The academic theory behind the design of the SKEW Index suggests that the Index should be high when the market falls, not the opposite.
I suspect that the reason the SKEW Index has been so effective as indicator in this perverse manner is because it shows that the market setup for a crash occurs when there is a low expectation of such an event. That is to say, the market is most fragile when it is perceived as not being fragile (i.e. everyone relaxes and takes no precautions). Subsequently, everyone is forced to panic and chase the market lower.
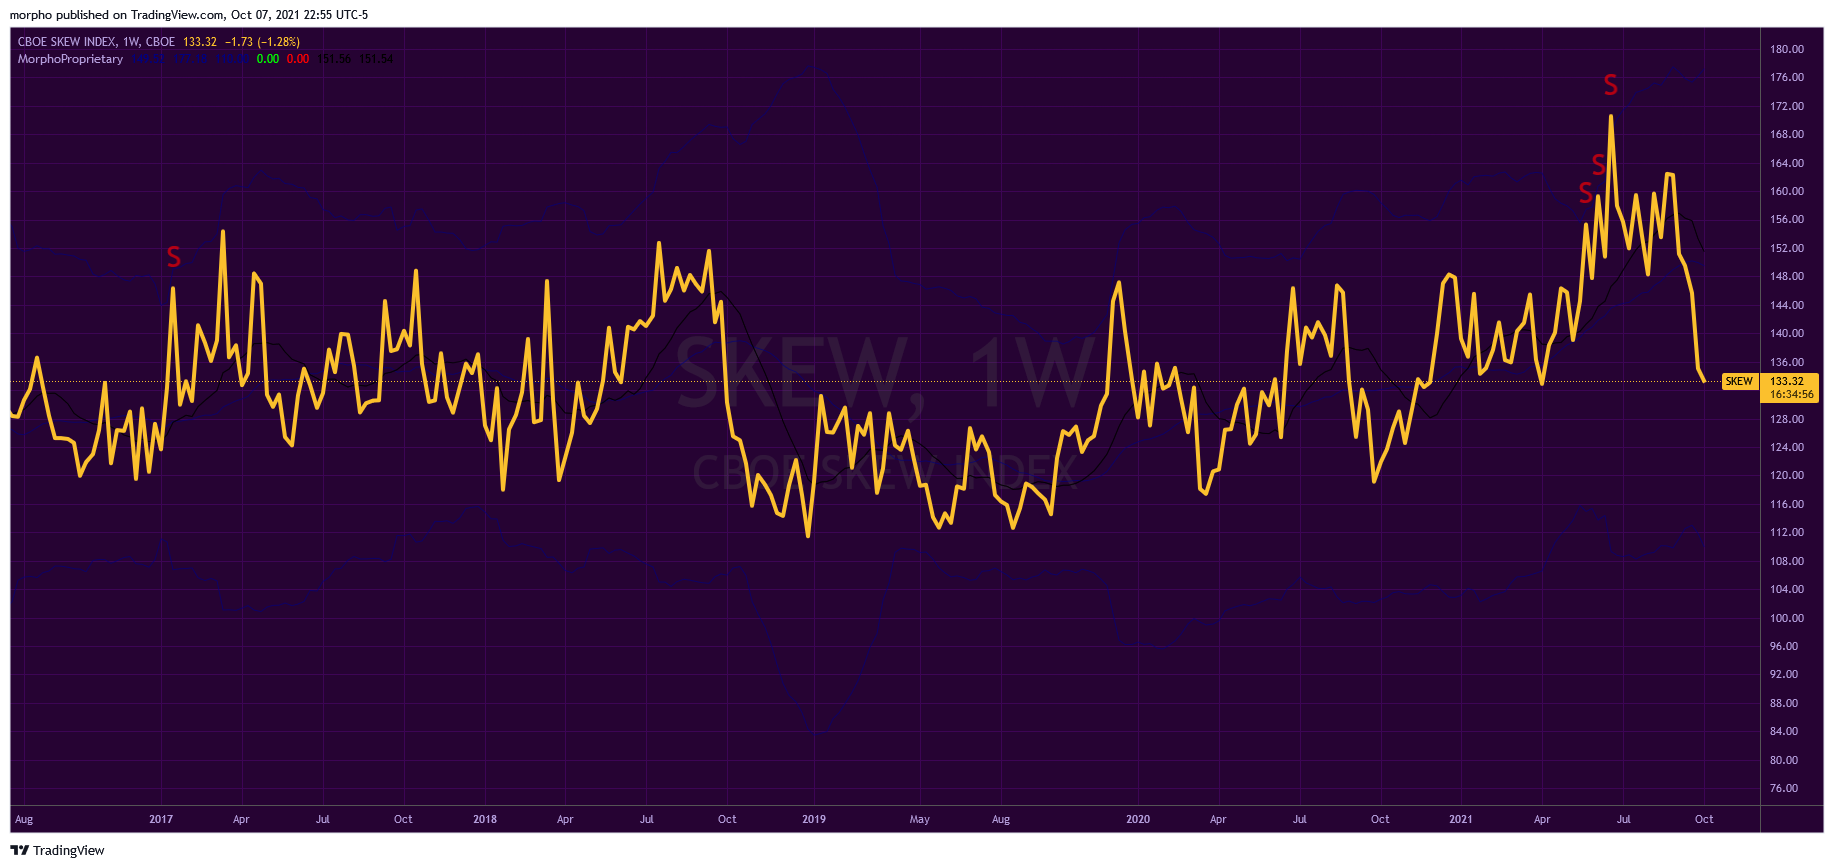
Here’s what happened to the SKEW Index and market subsequently (as we all know) …
So, why do I bring this up now? Well, as I’ve been suggesting in other posts, I expect markets (and economy) to look a bit shaky from around mid-2022. If the SKEW Index is to play ball with this outlook it will have to start falling fairly soon-ish, and stay down for a period of many months. Bear in mind that this is a very high-level indicator and not a precise timing indicator.
Guess what? It has recently fallen. It often does this when there has been a fall in the stock market, like the one we’ve recently seen. It seems that people feel somewhat relieved when market dips happen, as though the pressure has been taken out of the market and it can’t fall any further.
I’ve shared my view before. I think we are in the process of a larger market rollover that will take many months to play out (the top, that is). This is exactly the scenario required for the SKEW Index to stay down in my opinion. I expect the stock market to trade broadly sideways into mid-2022, and when I say broadly, I mean broadly. It could go up further, it could go down further from current levels. The specifics aren’t important at this stage. We are already seeing the upward momentum slowing, and with talk of a quick & dirty taper etc. …?
But that’s just my opinion about how things will play out, barring the unforeseen. And that is a clever segue into the next section, if I say so myself.
The Other Skew and what it says about risk
Because the “unforeseen” exists and is ever present, the best investment portfolios and strategies make allowance for it. They do this because they are designed with a consciousness of risk. This results in the returns from such an investment being positively skewed. By comparison, standard investments like the S&P 500, are negatively skewed. What does this mean?
Like I said, I’m no mathematician or statistician. Skew is a statistical term (i.e. not the Index) and refers to probability distribution - DON’T SWITCH OFF! I’ll try and keep it simple.
Most of the World of Finance is built upon the assumption that everything has a beautifully symmetrical Normal Distribution (also called a Bell Curve). That’s complete horse shit! There is always a tilt one way or t’other. Actually, it’s almost always one way and not t’other … unless you really go out of your way to make it so.
An awareness of this tilted behavior in your investment portfolio is of primary importance to understand the market risk you are taking. Sadly, even the majority of professionals do not contemplate this tilt even if they learned about it when studying finance theory.
The fact that the S&P 500 crashes every so often means that its returns are skewed to the downside - it has a long tail of negative returns - while the positive returns never reach the same size on the upside - they cluster in a fairly tight range.
This brings us to another statistical term: Kurtosis. In crude terms, where Skew refers to your investment returns being tilted to one side (usually the downside), Kurtosis refers to just how much the extreme events happen (e.g. those big negative returns due to market crashes). As I said, the S&P 500 experiences its most extreme returns to the downside due to market crashes. This means that the S&P 500 has its highest kurtosis when its skew is at its most negative - the worst possible combination from a risk perspective. It looks like this …

Before I started doing this typey writey stuff, I designed alternative investment strategies based on proprietary insights of my very own. They were so good that I was sure that they would stand out using traditional finance risk measurement metrics. They didn’t, which is what led me down this Skew and Kurtosis rabbit hole, trying to figure out why. The traditional measures used by the Asset Management industry do that “let’s assume everything is perfectly symmetrical” thing. That is to say, they don’t measure risk just happening to the downside, they also include positive returns as risk. How fucking dumb is that?! Anyhow, I developed my own measures of risk to fix that (and gained further insights along the way), but I won’t bore you with those abstractions in this episode. Instead, I’ll just show you the same chart as above, but applied to one of the strategies I developed …

Quite a difference, I’m sure you’ll agree.
The asset management professionals charged with managing your retirement portfolio don’t do anything to mitigate these risks. Despite their oft repeated disclaimer that “past performance is no guarantee of future results” (which is just legal ass covering on their part), they invest your money as though past portfolio construction will guarantee future portfolio performance. It’s not gonna happen, especially with bonds yielding near zero percent.

Know your enemy. Know your risk. Eventually, you’ll be skewered by the market, but the range of potential outcomes from that skewering can vary.