


Following the Yellow Brick Road
Beware of con men hiding behind curtains in positions of authority


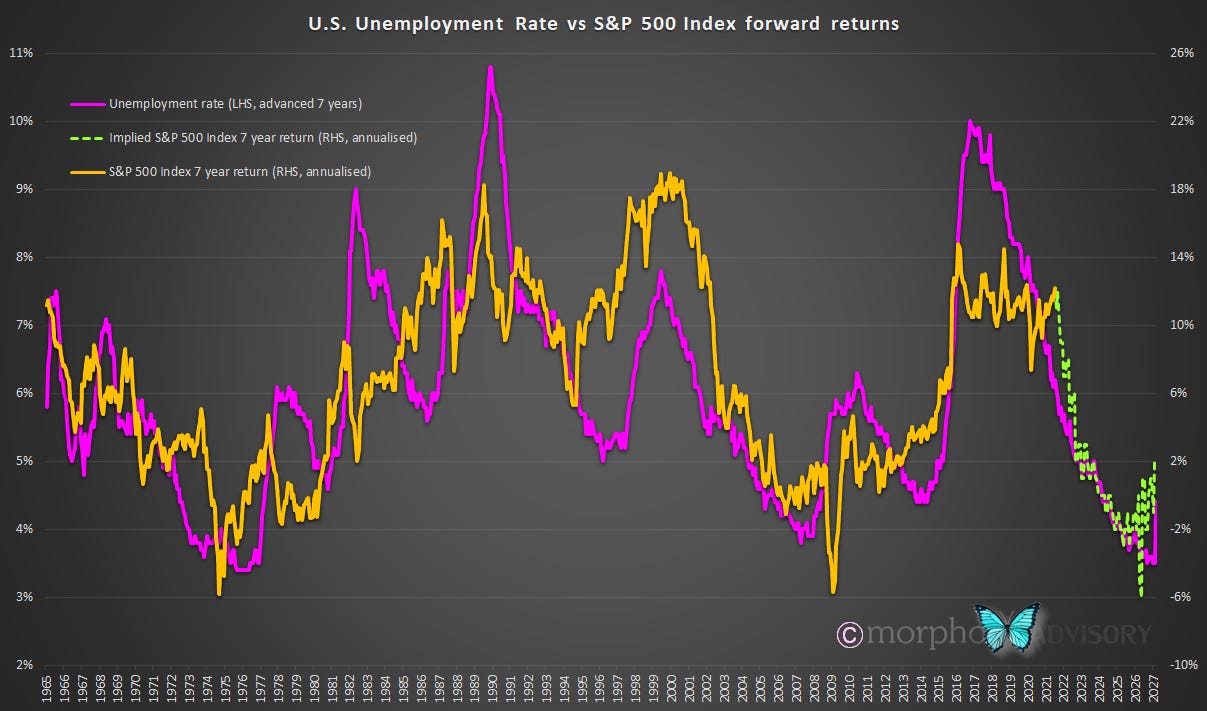
The recent addition to our analytical insights of the correlation of the U.S. unemployment rate (advanced 7 years) to the S&P 500 Index 7 year return (annualized) put us in mind of other quantitative analysis we’ve produced. A while back we discovered two other measures that showed a similar correlation.
When we produced both the correlation of Investor Allocation to Stocks and the Stock Market Capitalization to Household Assets and then advanced them by 10 years they showed a remarkable correlation to the 10 year compounded annual growth rate (CAGR) of the S&P 500 Index. But having done that, we thought, …
“if we produce a rough estimate of S&P 500 CAGRs that continues this correlation, we could reverse-engineer an implied level of the S&P 500 that would produce that correlation.”
The results were interesting. So interesting, in fact, that we thought, …
“lets create an aggregate of these two correlations and apply this methodology historically to see how well the implied forward rate performed against the actual S&P 500.”
What we produced were the following charts1.

Considering that the implied S&P 500 is based on data from 10 years prior, the relationship is remarkable. What is clear from the above charts - especially the bottom of the two - is that current market valuations are a long way from home. Nevertheless, it is fair to argue that correlation based models can be subject to significant variance irrespective of how well they have performed in the past. Which is why we were so keen to investigate our latest find and compare it.
The correlation of the U.S. unemployment rate (advanced 7 years) to the S&P 500 Index 7 year return (annualized) should have very little direct relationship to the Investor Allocation to Stocks and the Stock Market Capitalization to Household Assets from 10 years ago.
We replicated our earlier analysis, i.e. we created a rough estimate of the 7 year CAGR of the S&P 500 Index that would more or less maintain the historic correlation. From that estimate we were able to reverse-engineer an implied forward S&P 500 Index level 7 years into the future.
Bear in mind that our rough estimates of compounded annual growth rates are based on our eyeballing historic correlations and producing numbers that broadly replicate this. As such, any forecast of timing and levels are not aiming for accuracy. However, each analysis does give a good indication based on historic correlations of a reasonable expectation for the general direction and market levels in broad terms.
When we combine the implied forward level of the S&P 500 Index from our various models they tell an interesting story. Both suggest that sometime in the next 1-3 years that the S&P 500 Index should be trading approximately 2,000 points lower than current market values. If that happens it would be a loss of approximately 45% from the current level of 4,400.

This all begs the question, “Are we in a new paradigm? One where central bank QE will continue to underwrite the slightest of market wobbles and thus keep markets up at current levels? Will investors or federal government continue to accept the nation’s debt skyrocketing to support markets or people who choose not to return to work?” We think not. Demographics alone will put enough downward pressure on the economy over the coming decade, even if we escape the COVID-19 impact immediately. We also have the prospect of inflation, which we believe will be transitory (i.e. be a thing of the past within 2 years), but that doesn’t stop it acting like a Fed tightening cycle in the interim and taking disposable income away from people.
In the Wizard of Oz, the Scarecrow; the Tin Man; the Lion; and Dorothy had to go through trials in order to find out that they already possessed what they thought they needed. If that’s what you need as an investor then stick around, you’ll get your opportunity. Alternatively, you could apply yourself to some thought and put in some effort in advance. Remember: markets go up by the stairs and down by the elevator. There’s a whole generation trading at present who haven’t really experienced that, and nothing turns sentiment so fast as falling prices. In fact, there is not a single person in the workforce today (outside of Japan and look what happened to their economy since 1990) that has experienced the economic impacts of a shrinking working age population. Ultimately, everything in life, economics and markets experiences some form of reversion. Another way to put it is, …
“There’s no place like home.”
We also produced a Euphoria Index that measured the percentage variation between the S&P 500 and the implied forward S&P 500 (not shown here) that gave an interesting representation of when the market was trading above or below one definition of the long-term ‘fair value’.