


I hear there’s a New Paradigm in town
AKA "It's different this time"


Liquidity is the new paradigm
Liquidity is the new paradigm. The old way of doing things is out. That’s the word on the street.
But what is liquidity?
Liquidity, crudely speaking, is money-supply. For a long time, it was the way policy makers sent a signal to markets about the cost of money through the interplay of supply and demand (e.g. more money in the financial system means the cost of money falls and vice versa). This process is called Open Market Operations. Then came inflation targeting by central banks and official cash rates (e.g. the Fed Funds Rate). However, when interest rates hit zero (the “lower bound”) after the GFC, what was a central banker to do? The market (by which I mean a ‘rational investor’) wants a risk premium on investments to increase in that situation to be adequately compensated (e.g. a term premium on fixed income securities … which means “I don’t want to commit to investing at a low rate for a long period of time, so add a bit more yield to entice me into the deal”). But central banks don’t want risk to be priced properly, so they buy fixed income assets to suppress the market interest rate on Treasury Bills, Notes and Bonds against which all risk assets are valued. They are now lowering interest rates – the cost of money – by direct market intervention with the aim of stimulating the economy (just like lowering the Fed Funds Rate).
In light of this mechanism, it’s only natural that QE asset purchases (i.e. liquidity) would lead to rising asset prices (e.g. stocks) because, as I have illustrated before, asset prices are a function of the cost of money (i.e. interest rates).
The New Paradigm implies that all the new system liquidity is the sole causation of rising prices that we see in the stock market. Because we’ve had this QE liquidity world for well over a decade, it has resulted in many market participants forgetting that rising interest rates matter too - more so, in my opinion because higher base rates hit everything whereas liquidity hits at the margin. Additionally, I would suggest people look at the difference between global liquidity and U.S. liquidity too.


What to believe?
Have people forgotten about the high cost of living and higher debt-servicing hitting households around the world? Have people forgotten about the inverted yield curve? Have they forgotten about weak manufacturing activity? Have people forgotten the earnings warnings and rising layoffs? Have they forgotten that it is only a handful of stocks holding up the entire S&P 500 Index? Let’s look at this last point by way of stocks outside of the S&P 500 and what they are up to.

The Russell 2000 Index, which captures small-cap U.S. stocks, moves closely in line with system liquidity. That’s because these smaller companies are more sensitive to cost of capital, so liquidity and rising interest rates hit them more immediately. These small-cap stocks are also a better representation of the real economy, whereas the S&P 500 represents the financial economy where momentum plays a greater part. We can see this aspect when we compare the two indices.

There is typically a divergence in stock prices before a recession. Small-caps fall first while large-cap stocks sail higher for a while longer. The tightening cycle is having its impact and the more vulnerable are affected earliest.
Before I sign off on the liquidity topic, here’s another way to look at system liquidity and money supply.
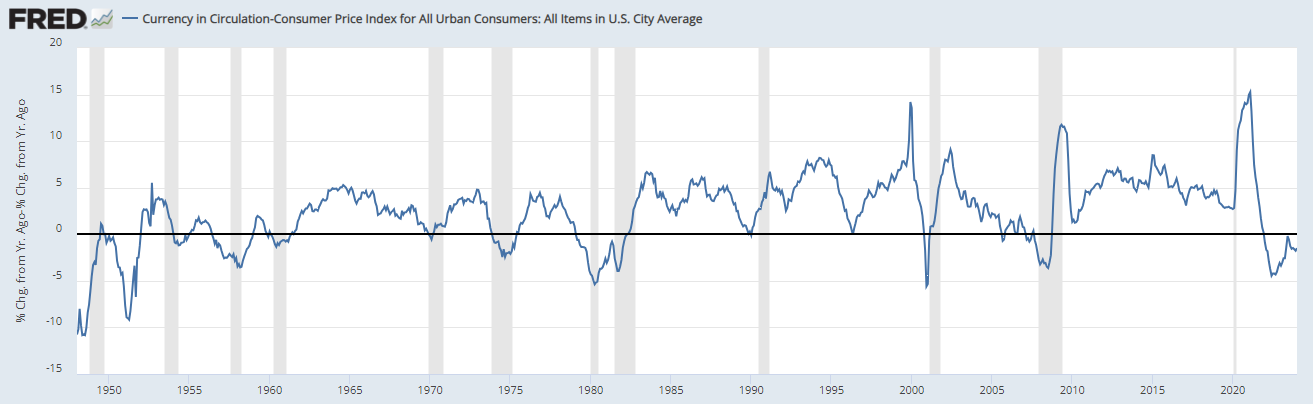
This chart is U.S. currency in circulation measured on a year-over-year percentage growth rate less the annual rate of inflation. All things economic are measured in terms of their growth rate and they very often are also measured in ‘real’ terms (i.e. adjusted for inflation) so that we get a sense of purchasing power in relative terms. Like many of the charts I have shown on this site, such a measure as this goes negative prior to a recession … and it’s happening again now. Interesting.
Does the market often misinterpret data?
I say that people are looking in the wrong place or looking at things incorrectly and so are misinterpreting the available information … but that’s the nature of New Paradigms. During the New paradigm phase there’s a divergence between price and fundamentals, so justification is sought for prices being high, and staying high, if not going higher still, rather than attempting to gain a holistic understanding of the situation and let that inform people in terms of which bit is out of alignment.
The other major theme I see doing the rounds at present is how inflation is going to be more persistent. This is because we saw January’s U.S. CPI number come out higher than expected and now everyone is saying how it looks like inflation is going to push higher once again.
I pointed out in August 2023 that inflation was likely to experience a pause of its downward path. What gave me such prescience? Oil.
Everyone was surprised by January’s U.S. inflation number released in mid-February, it being higher than expected. As a result, sentiment of the talking and tweeting (or is that X-ing?) heads, has now swung to inflation being persistent and here to stay etc.
*sigh* Back to basics.
The economy is the financial behavior of the collective. The market is the behavior of the people without a cohesive understanding of the economy in a real-world context (… and that includes many/most economists), so they run this way and that as they change their minds about what is going on in the economy (and market) and what it means, usually by extrapolating the most recent news headlines and running with the groupthink of the day.
I pointed out a while back – a couple of times – that inflation is pretty much reflected in the change in the price of oil. This is because oil is such a crucial element in much of our industrial world, whether we like to admit it or not.
Here’s a chart of the change in the price of oil on a year-over-year basis in percentage terms (also divided by 26 plus 2 just to scale it down and shift it up slightly). It pretty much equates to the annual U.S. inflation rate. I mentioned last August that the price of oil had started to rise after falling substantially, which would feed into the inflation rate unless the price of oil rolled over again.

Lo and behold, the rise in the price of oil over the last year has now resulted in a pause in the fall of the annual rate of inflation for the U.S.
As for inflation being persistent, that’s unlikely to eventuate in manner that the current groupthink supposes, but posters gotta post and daily news outlets gotta news daily.
I say this because the change in the price of oil in year-over-year percentage terms correlates to the economic cycle. In the following chart, the year-over-year percentage change in the price of oil (this time divided by 5 - just to illustrate the correlation) matches PMI data, specifically Manufacturing New Orders, which I’ve been saying is looking like turning down once again after the temporary pause in its weakening trajectory recently … (not forgetting rising unemployment and the flow-on effect of that on consumer demand etc.).

So, you see, it’s all one. It’s all connected: consumer demand → debt → policy setting → interest rates → consumer demand → manufacturing → commodity prices → inflation → more policy setting → unemployment etc. It’s all the same cycle repeated everywhere.
Once you understand the economic cycle, which is just collective behavior of the masses, then you can turn your attention to the collective behavior in markets, which is the erratic swings of those with limited economic understanding (i.e. they understand parts, but most don’t have a holistic view), being a combination of bandwagon/groupthink behavior and market positioning-based reactions. Be warned though, the ignorant can stay ignorant for long periods. And a bunch of them can make markets move contrary to rational understanding in a big way. But if you’re patient, you can profit from their swings.
Cost of capital
And seeing as I’ve been talking about cost of capital … I came across an article about equity being cheaper than debt, that says more companies are beginning to look at selling their shares rather than borrowing. That’s a promising development after decades of weakening corporate balance sheets. However, it is something quite different from the buyback frenzy of the last decade, which has helped stock prices rise. Oops! There’s that cost-of-money thing impacting stock prices again.